
Concept explainers
Videos
For Exercises 28 through 33, do a complete regression analysis by performing these steps.
a. Draw a
b. Compute the
c. State the hypotheses.
d. Test the hypotheses at α = 0.05. Use Table I.
e. Determine the regression line equation if r is significant.
f. Plot the regression line on the scatter plot, if appropriate.
g. Summarize the results.
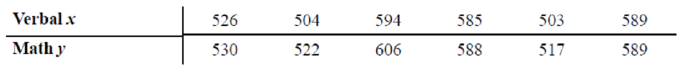
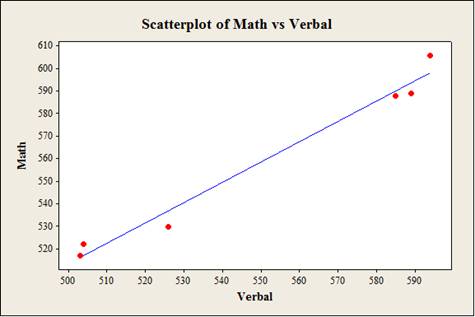
30. SAT Scores Educational researchers desired to find out if a relationship exists between the average SAT verbal score and the average SAT mathematical score. Several states were randomly selected, and their SAT average scores are recorded below. Is there sufficient evidence to conclude a relationship between the two scores?
a.
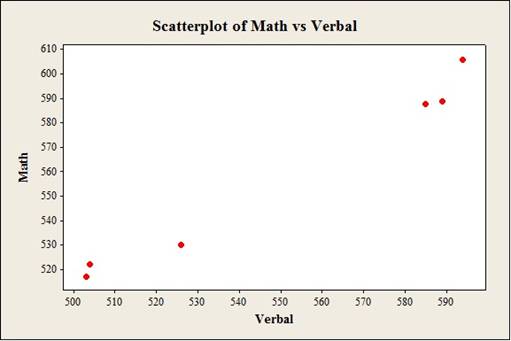
To construct: The scatterplot for the variables the average SAT verbal score and the average SAT mathematical score.
Answer to Problem 30E
Output using the MINITAB software is given below:
Explanation of Solution
Given info:
The data shows the average SAT verbal score (x) and the average SAT mathematical score (y) values.
Calculation:
Step by step procedure to obtain scatterplot using the MINITAB software:
- Choose Graph > Scatterplot.
- Choose Simple and then click OK.
- Under Y variables, enter a column of Verbal.
- Under X variables, enter a column of Math.
- Click OK.
b.
To compute: The value of the correlation coefficient.
Answer to Problem 30E
The value of the correlation coefficient is 0.990.
Explanation of Solution
Calculation:
Correlation coefficient r:
Software Procedure:
Step-by-step procedure to obtain the ‘correlation coefficient’ using the MINITAB software:
- Select Stat > Basic Statistics > Correlation.
- In Variables, select x and y from the box on the left.
- Click OK.
Output using the MINITAB software is given below:
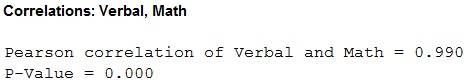
From the MINITAB output, the value of the correlation is 0.990.
c.
To state: The hypothesis.
Answer to Problem 30E
The null hypothesis is
The alternative hypothesis is
Explanation of Solution
Calculation:
The hypotheses are given below:
Null hypothesis:
That is, there is no linear relation between the average SAT verbal score and the average SAT mathematical score.
Alternative hypothesis:
That is, there is a linear relation between the average SAT verbal score and the average SAT mathematical score.
d.
To test: The significance of the correlation coefficient at
Answer to Problem 30E
The conclusion is that, there is sufficient evidence to support the claim that linear relation between the average SAT verbal score and the average SAT mathematical score.
Explanation of Solution
Given info:
The level of significance is
Calculation:
The sample size is 6.
The formula to find the degrees of the freedom is
That is,
From the “TABLE –I: Critical Values for the PPMC”, the critical value for 4 degrees of freedom and
Rejection Rule:
If the absolute value of r is greater than the critical value then reject the null hypothesis.
Conclusion:
From part (b), the value of r is 0.990 That is the absolute value of r is 0.990.
Here, the absolute value of r is greater than the critical value
That is,
By the rejection rule, reject the null hypothesis.
There is sufficient evidence to support the claim that “there is a linear relation between the average SAT verbal score and the average SAT mathematical score”.
e.
To find: The regression equation for the given data.
Answer to Problem 30E
The regression equation for the given data is
Explanation of Solution
Calculation:
Regression:
Software procedure:
Step by step procedure to obtain the regression equation using the MINITAB software:
- Choose Stat > Regression > Regression.
- In Responses, enter the column of Math.
- In Predictors, enter the column of Verbal.
- Click OK.
Output using the MINITAB software is given below:
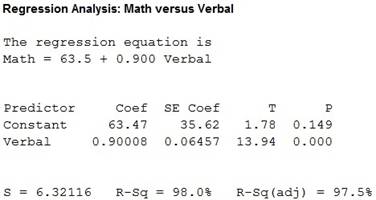
Thus, regression equation for the given data is
f.
To construct: The scatterplot for the variables the average SAT verbal score and the average SAT mathematical score with regression line.
Answer to Problem 30E
Output using the MINITAB software is given below:
Explanation of Solution
Calculation:
Step by step procedure to obtain scatterplot using the MINITAB software:
- Choose Graph > Scatterplot.
- Choose with line and then click OK.
- Under Y variables, enter a column of Verbal.
- Under X variables, enter a column of Math.
- Click OK.
g.
To summarize: The results.
Answer to Problem 30E
Explanation of Solution
Justification:
Thus, there is sufficient evidence to support the claim that “there is a linear relation between the average SAT verbal score and the average SAT mathematical score”.
Want to see more full solutions like this?
Chapter 10 Solutions
Elementary Statistics: A Step By Step Approach


 Glencoe Algebra 1, Student Edition, 9780079039897...AlgebraISBN:9780079039897Author:CarterPublisher:McGraw Hill
 Calculus For The Life SciencesCalculusISBN:9780321964038Author:GREENWELL, Raymond N., RITCHEY, Nathan P., Lial, Margaret L.Publisher:Pearson Addison Wesley,
 Big Ideas Math A Bridge To Success Algebra 1: Stu...AlgebraISBN:9781680331141Author:HOUGHTON MIFFLIN HARCOURTPublisher:Houghton Mifflin Harcourt
 Functions and Change: A Modeling Approach to Coll...AlgebraISBN:9781337111348Author:Bruce Crauder, Benny Evans, Alan NoellPublisher:Cengage Learning