
Videos
a)
To determine: The probability of earning more than 10 percent on long-term corporate bonds.
Introduction:
The
Standard deviation refers to the variation in the actual observations from the average.
Z-Score helps to know how many numbers of standard deviations is the raw score or outcome away from the average or mean.
a)
Answer to Problem 28QP
The probability of earning more than 10 percent on long-term corporate bonds is 33.41 percent.
Explanation of Solution
Given information:
Assume that the returns of long-term corporate bonds have a normal distribution. The average return or mean of long-term corporate bonds is 6.4 percent, and the standard deviation is 8.4 percent (Refer to Figure 10.10 in the text).
Determine the probability of having a return greater than 10 percent on long-term government bonds:
Follow the common steps from Step 1 to Step 3 given below. Then, proceed with the Step 4.
The common steps to be followed to use the “NORM.DIST” function in Excel:
Step 1:
Open an Excel worksheet.
Step 2:
Place the cursor in cell A1.

Step 3:
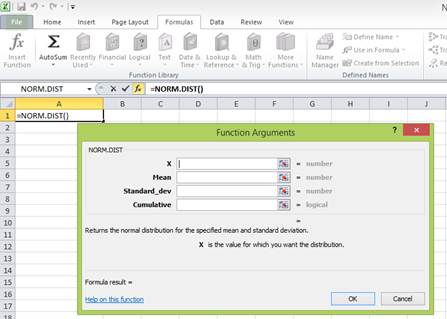
Select the “Formulas” tab, and go to “More functions” in the ribbon. Under “More functions”, select “Statistical”. Under the drop-down menu of “Statistical”, select “NORM.DIST” function.
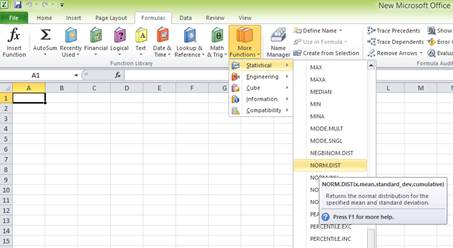
After clicking the “NORM.DIST” function, a popup window named “Function arguments” appears.

Step 4:
Enter the values. “X” represents the raw score or outcome. Here, it is necessary to test the probability of having more than 10 percent returns. Hence, “X” equals 10 percent. The mean or average return is 6.4 percent. The standard deviation is 8.4 percent. The cumulative distribution function provides the probability of the area to the left of Z. Hence, enter “TRUE” in the “Cumulative” column.
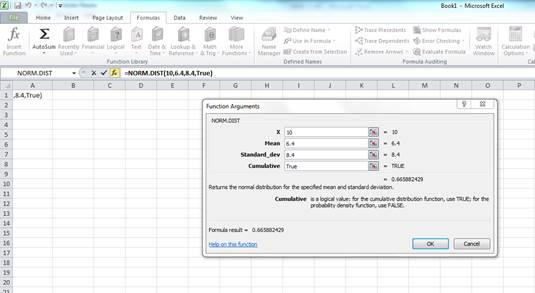
Press “OK” after providing the inputs. The probability of the area to the left of Z is as follows:
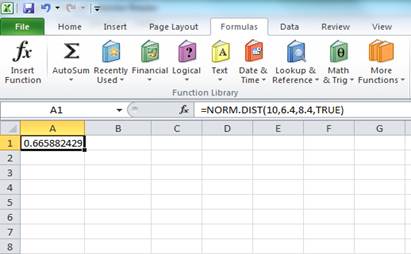
The probability of 0.665882 represents the area to the left of Z. The area to the left of Z is the probability of getting less than 10 percent return. The area to the right of Z is the probability of getting a return of 10 percent or more.
The total area represented by the normal distribution curve has a probability of “1”. The area to the left of Z has a probability of 0.665882. Hence, the probability of the area to the right of Z is “1” minus the probability of the area to the left of Z. Hence, the probability of getting 10 percent return or more is 0.334118 or 33.4118 percent
To determine: The probability of earning less than 0 percent on long-term corporate bonds
Answer to Problem 28QP
The probability of earning less than 0 percent on long-term corporate bonds is 0.223058 or 0.223058 percent
Explanation of Solution
Given information:
Assume that the returns of long-term corporate bonds have a normal distribution. The average return or mean of long-term corporate bonds is 6.4 percent, and the standard deviation is 8.4 percent (Refer to Figure 10.10 in the text).
Determine the probability of having a return less than 0 percent on long-term government bonds:
Follow the common steps from Step 1 to Step 3 given below. Then, proceed with the Step 4.
The common steps to be followed to use the “NORM.DIST” function in Excel:
Step 1:
Open an Excel worksheet.
Step 2:
Place the cursor in cell A1.

Step 3:
Select the “Formulas” tab, and go to “More functions” in the ribbon. Under “More functions”, select “Statistical”. Under the drop-down menu of “Statistical”, select “NORM.DIST” function.

After clicking the “NORM.DIST” function, a popup window named “Function arguments” appears.

Step 4:
Enter the values. “X” represents the raw score or outcome. Here, it is necessary to test the probability of having (0 percent) return or less. Hence, “X” equals (0 percent). The mean or average return is 6.4 percent. The standard deviation is 8.4 percent. The cumulative distribution function provides the probability of the area to the left of Z. Hence, enter “TRUE” in the “Cumulative” column.
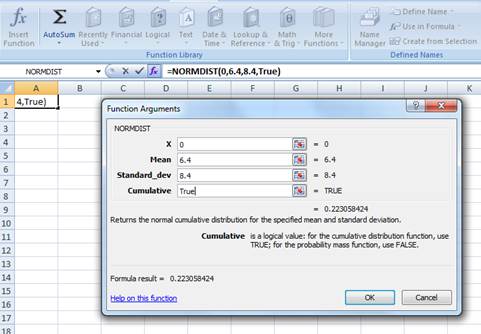
Press “OK” after providing the inputs. The probability of the area to the left of Z is as follows:
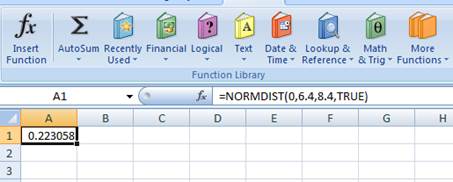
The probability of 0.223058 represents the area to the left of Z. The area to the left of Z refers to the probability of getting (0 percent) return or less because the left-hand side of the normal distribution curve indicates negative returns. Hence, the probability of earning less than 0 percent is 0.223058 or 0.223058 percent.
b)
To determine: The probability of earning more than 10 percent on Treasury bills
b)
Answer to Problem 28QP
The probability of earning more than 10 percent on Treasury bills is 0.018006785 or 1.80 percent.
Explanation of Solution
Given information:
Assume that the returns of Treasury bills have a normal distribution. The average return or mean of Treasury bills is 3.5 percent, and the standard deviation is 3.1 percent (Refer to Figure 10.10 in the textbook).
Determine the probability of having a return greater than 10 percent on Treasury bills:
Follow the common steps from Step 1 to Step 3 given below. Then, proceed with the Step 4.
The common steps to be followed to use the “NORM.DIST” function in Excel:
Step 1:
Open an Excel worksheet.
Step 2:
Place the cursor in cell A1.
Step 3:
Select the “Formulas” tab, and go to “More functions” in the ribbon. Under “More functions”, select “Statistical”. Under the drop-down menu of “Statistical”, select “NORM.DIST” function.

After clicking the “NORM.DIST” function, a popup window named “Function arguments” appears.

Step 4:
Enter the values. “X” represents the raw score or outcome. Here, it is necessary to test the probability of having more than 10 percent returns. Hence, “X” equals 10 percent. The mean or average return is 3.5 percent. The standard deviation is 3.1 percent. The cumulative distribution function provides the probability of the area to the left of Z. Hence, enter “TRUE” in the “Cumulative” column.
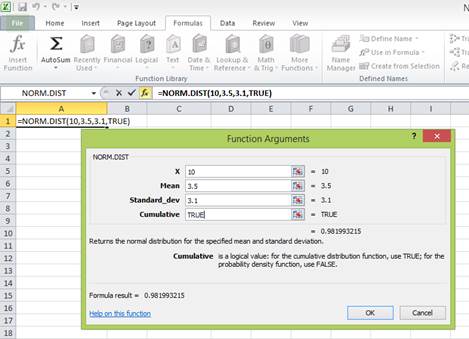
Press “OK” after providing the inputs. The probability of the area to the left of Z is as follows:
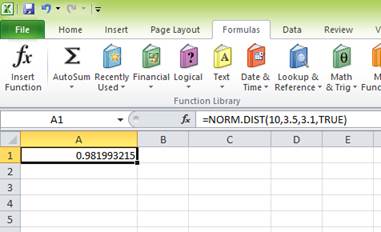
The probability of 0.981993215 represents the area to the left of Z. The area to the left of Z is the probability of getting less than 10 percent return. The area to the right of Z is the probability of getting a return of 10 percent or more.
The total area represented by the normal distribution curve has a probability of “1”. The area to the left of Z has a probability of 0.981993215. Hence, the probability of the area to the right of Z is “1” minus the probability of the area to the left of Z. Hence, the probability of getting 10 percent return or more is 0.018006785 or 1.80 percent
To determine: The probability of earning less than 0 percent on Treasury bills.
Answer to Problem 28QP
The probability of earning less than 0 percent on Treasury bills is 0.129442113 or 12.94 percent.
Explanation of Solution
Given information:
Assume that the returns of Treasury bills have a normal distribution. The average return or mean of Treasury bills is 3.5 percent, and the standard deviation is 3.1 percent (Refer to Figure 10.10 in the text).
Determine the probability of having a return less than 0 percent on Treasury bills:
Follow the common steps from Step 1 to Step 3 given below. Then, proceed with the Step 4.
The common steps to be followed to use the “NORM.DIST” function in Excel:
Step 1:
Open an Excel worksheet.
Step 2:
Place the cursor in cell A1.

Step 3:
Select the “Formulas” tab, and go to “More functions” in the ribbon. Under “More functions”, select “Statistical”. Under the drop-down menu of “Statistical”, select “NORM.DIST” function.
After clicking the “NORM.DIST” function, a popup window named “Function arguments” appears.

Step 4:
Enter the values. “X” represents the raw score or outcome. Here, it is necessary to test the probability of having (0 percent) return or less. Hence, “X” equals (0 percent). The mean or average return is 3.5 percent. The standard deviation is 3.1 percent. The cumulative distribution function provides the probability of the area to the left of Z. Hence, enter “TRUE” in the “Cumulative” column.
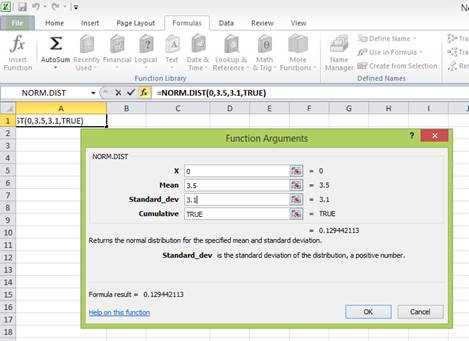
Press “OK” after providing the inputs. The probability of the area to the left of Z is as follows:
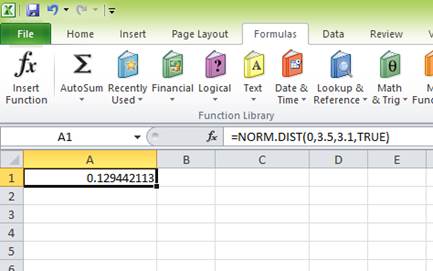
The probability of 0.129442113 represents the area to the left of Z. The area to the left of Z refers to the probability of getting (0 percent) return or less because the left-hand side of the normal distribution curve indicates negative returns. Hence, the probability of earning less than 0 percent is 0.129442113 or 12.94 percent.
c)
To determine: The probability of earning (4.18 percent) on long-term corporate bonds.
c)
Answer to Problem 28QP
The probability of earning (4.18 percent) on long-term corporate bonds is 0.1039 or 10.39 percent.
Explanation of Solution
Given information:
Assume that the returns of long-term corporate bonds have a normal distribution. The average return or mean of long-term corporate bonds is 6.4 percent, and the standard deviation is 8.4 percent (Refer to Figure 10.10 in the textbook).
Determine the probability of having (4.18 percent) on long-term government bonds:
Follow the common steps from Step 1 to Step 3 given below. Then, proceed with the Step 4.
The common steps to be followed to use the “NORM.DIST” function in Excel:
Step 1:
Open an Excel worksheet.
Step 2:
Place the cursor in cell A1.

Step 3:
Select the “Formulas” tab, and go to “More functions” in the ribbon. Under “More functions”, select “Statistical”. Under the drop-down menu of “Statistical”, select “NORM.DIST” function.
After clicking the “NORM.DIST” function, a popup window named “Function arguments” appears.
Step 4:
Enter the values. “X” represents the raw score or outcome. Here, it is necessary to test the probability of having (4.18 percent) return or less. Hence, “X” equals (4.18 percent). The mean or average return is 6.4 percent. The standard deviation is 8.4 percent. The cumulative distribution function provides the probability of the area to the left of Z. Hence, enter “TRUE” in the “Cumulative” column.
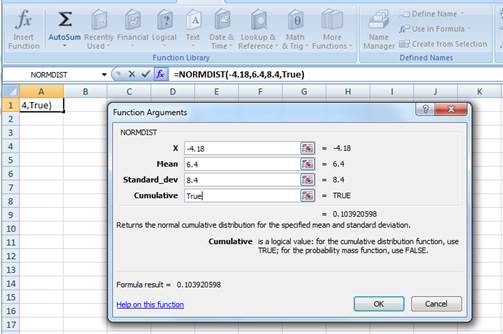
Press “OK” after providing the inputs. The probability of the area to the left of Z is as follows:
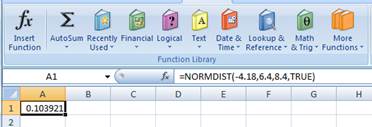
The probability of 0.103921 represents the area to the left of Z. The area to the left of Z refers to the probability of getting (4.18 percent) return or less because the left-hand side of the normal distribution curve indicates negative returns. Hence, the probability of earning (4.18 percent) is 0.1039 or 10.39 percent.
To determine: The probability of earning 10.56 percent on Treasury bills.
Answer to Problem 28QP
The probability of earning 10.56 percent on Treasury bills is 0.011380598 or 1.14 percent
Explanation of Solution
Given information:
Assume that the returns of Treasury bills have a normal distribution. The average return or mean of Treasury bills is 3.5 percent, and the standard deviation is 3.1 percent (Refer to Figure 10.10 in the text).
Determine the probability of having a return of 10.56 percent on Treasury bills:
Follow the common steps from Step 1 to Step 3 given below. Then, proceed with the Step 4.
The common steps to be followed to use the “NORM.DIST” function in Excel:
Step 1:
Open an Excel worksheet.
Step 2:
Place the cursor in cell A1.

Step 3:
Select the “Formulas” tab, and go to “More functions” in the ribbon. Under “More functions”, select “Statistical”. Under the drop-down menu of “Statistical”, select “NORM.DIST” function.
After clicking the “NORM.DIST” function, a popup window named “Function arguments” appears.
Step 4:
Enter the values. “X” represents the raw score or outcome. Here, it is necessary to test the probability of having 10.56 percent returns. Hence, “X” equals 10.56 percent. The mean or average return is 3.5 percent. The standard deviation is 3.1 percent. The cumulative distribution function provides the probability of the area to the left of Z. Hence, enter “TRUE” in the “Cumulative” column.
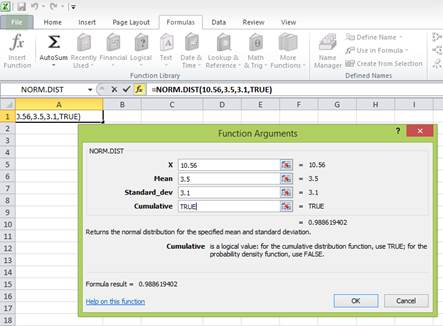
Press “OK” after providing the inputs. The probability of the area to the left of Z is as follows:
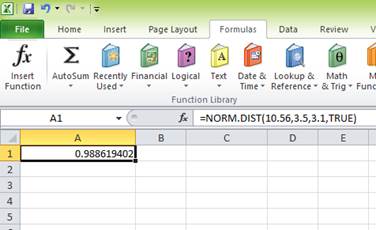
The probability of 0.988619402 represents the area to the left of Z. The area to the left of Z is the probability of getting less than 10.56 percent return. The area to the right of Z is the probability of getting a return of 10.56 percent or more.
The total area represented by the normal distribution curve has a probability of “1”. The area to the left of Z has a probability of 0.988619402. Hence, the probability of the area to the right of Z is “1” minus the probability of the area to the left of Z. Hence, the probability of getting 10.56 percent return or more is 0.011380598 or 1.14 percent
Want to see more full solutions like this?
Chapter 10 Solutions
Essentials of Corporate Finance (Mcgraw-hill/Irwin Series in Finance, Insurance, and Real Estate)


- What is the stand-alone risk? Use the scenario data to calculate the standard deviation of the bonds return for the next year.arrow_forwardwhich of the following past returns should mutual funds publish in their annual reports? A.Excess return B.Geometric average return C.Arithmetric average return D.Index returnarrow_forwardWhy do we discount the future in valuing investments today that are expected to provide returns in the future? Explain with examples. Define & explain Annual Percentage Rate (APR) & the Effective Annual Rate (EAR). What is the relationship between APR & EAR? The discounting of the future is assumed to be exponential. What does behavioral finance have to say about this assumption? What is hyperbolic discounting?arrow_forward
- 1. What is the required rate of return for the common equity shareholders using CAPM? 2. Use the year-end 2020 data to compute the market-to-book ratio. 3. What is the implied value to book ratio?arrow_forwardAssume these are the stock market and Treasury bill returns for a 5-year period: Required: a. What was the risk premium on common stock in each year? b. What was the average risk premium? c. What was the standard deviation of the risk premium? (Ignore that the estimation is from a sample of data.)arrow_forwardRemember, the expected value of a probability distribution is a statistical measure of the average (mean) value expected to occur during all possible circumstances. To compute an asset's expected return under a range of possible circumstances (or states of nature), multiply the anticipated return expected to result during each state of nature by its probability of occurrence. Consider the following case: Aaron owns a two-stock portfolio that invests in Blue Liama Mining Company (BLM) and Hungry Whale Energy (HWE). Three-quarters of Aaron's portfolio value consists of BLM's shares, and the balance consists of HWE's shares. Each stock's expected return for the next year will depend on forecasted market conditions. The expected returns from the stocks in different market conditions are detailed in the following table: Market Condition Probability of Occurrence 20% 35% 45% Strong Normal Weak Blue Llama Mining Hungry Whale Energy, 10% 14% 6% -8% 8% -10% Calculate expected returns for the…arrow_forward
- f. Estimate Bartman's and Reynolds's betas by running regressions of their returns against the index's returns. Round your answers to four decimal places. Bartman's beta: fill in the blank 30 Reynolds's beta: fill in the blank 31 Are these betas consistent with your graph? These betas consistent with the scatter diagrams. g. Assume that the risk-free rate on long-term Treasury bonds is 4.5%. Assume also that the average annual return on the Winslow 5000 is not a good estimate of the market's required return—it is too high. So use 9% as the expected return on the market. Use the SML equation to calculate the two companies' required returns. Round your answers to two decimal places. Bartman's required return: fill in the blank 33 % Reynolds's required return: fill in the blank 34 % h. If you formed a portfolio that consisted of 50% Bartman and 50% Reynolds, what would the portfolio's beta and required return be? Round your answer for the portfolio's beta to four decimal places and…arrow_forwardAssume that the expected return and standard deviation of the company stock will be 17 percent, respectively. How appropriate is the sharpe ratio for these assets? When would you use the sharpe ratio?arrow_forwardIf d1 = 1.25, g (which is constant) = 4.7%, and Po = $26, what is the expected dividend yield for the coming year? Bond valuation related problems should be solved by using a financial calculator or MS excel spreadsheet. Accordingly, you must show the values of all relevant time valu of money variablesarrow_forward
- You are comparing Stock A to Stock B. Given the following information, what is the difference in the expected returns of these two securities? State of Economy Probability of State of Economy Rate of Return if State Occurs Stock A Stock B Normal .75 .13 .16 Recession .25 −.05 −.21arrow_forwardUse the investment opportunity set and data shown on the excel file attached. What will be the Weight of Bonds in the Optimum Portfolio, given this investment opportunity set? Round to two decimals. for example, 0.12arrow_forwardIn which Market debt and stocks are traded and maturity period is more than a year? A. Money Market B. Share Market C. Short Term Market D. Capital Marketarrow_forward


 Intermediate Financial Management (MindTap Course...FinanceISBN:9781337395083Author:Eugene F. Brigham, Phillip R. DavesPublisher:Cengage Learning