
Concept explainers
Videos
For Exercises 1 through 7, do a complete regression analysis by performing the following steps.
a. Draw the
b. Compute the value of the
c. Test the significance of the correlation coefficient at α = 0.01, using Table I.
d. Determine the regression line equation if r is significant.
e. Plot the regression line on the scatter plot, if appropriate.
f. Predict y′ for a specific value of x, if appropriate.
Sections 10–1 and 10–2
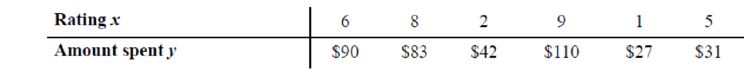
1. Customer Satisfaction and Purchases At a large department store customers were asked to rate the service and the materials purchased on a scale from 1 to 10, with 10 being the highest rating. Then the amount that they spent was recorded. Is there evidence of a relationship between the rating and the amount that they spent?
a.
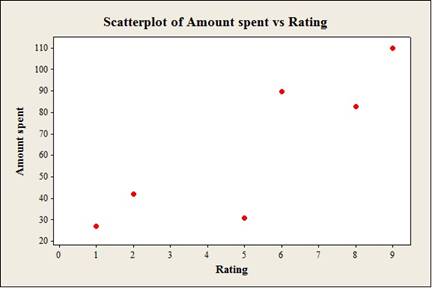
To construct: The scatterplot for the variablesthe rating and the amount spent.
Answer to Problem 10.1.1RE
Output using the MINITAB software is given below:
Explanation of Solution
Given info:
The data shows the rating the rating and the amount spent (y) values.
Calculation:
Step by step procedure to obtain scatterplot using the MINITAB software:
- Choose Graph > Scatterplot.
- Choose Simple and then click OK.
- Under Y variables, enter a column ofRating.
- Under X variables, enter a column ofAmount spent.
- Click OK.
b.
To compute: The value of the correlation coefficient.
Answer to Problem 10.1.1RE
The value of the correlation coefficientis 0.864.
Explanation of Solution
Calculation:
Correlation coefficient r:
Software Procedure:
Step-by-step procedure to obtain the ‘correlation coefficient’ using the MINITAB software:
- Select Stat >Basic Statistics > Correlation.
- In Variables, select x and y from the box on the left.
- Click OK.
Output using the MINITAB software is given below:
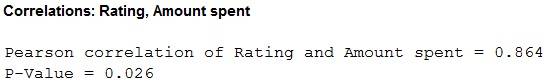
From the MINITAB output, the value of the correlation is 0.864.
c.
To test: The significance of the correlation coefficient at
Answer to Problem 10.1.1RE
The conclusion is that,there is no linear relation between the rating and the amount spent.
Explanation of Solution
Given info:
The level of significance is
Calculation:
The hypotheses are given below:
Null hypothesis:
That is, there is no linear relation betweenthe rating and the amount spent.
Alternative hypothesis:
That is, there is a linear relation between the rating and the amount spent.
The sample size is 6.
The formula to find the degrees of the freedom is
That is,
From the “TABLE –I: Critical Values for the PPMC”, the critical value for 4 degrees of freedom and
Rejection Rule:
If the absolute value of r is greater than the critical value then reject the null hypothesis.
Conclusion:
From part (b), the value of r is0.864 that is the absolute value of r is 0.864.
Here, the absolute value of r is less than the critical value
That is,
By the rejection rule,accept the null hypothesis.
There is no sufficient evidence to support the claim that “there is alinear relation betweenthe rating and the amount spent”.
d.
To find: The regression equation for the given data.
Answer to Problem 10.1.1RE
The regression equation for the given is not valid.
Explanation of Solution
it is observed that the r is not significant.
Thus, the regression is not valid.
Want to see more full solutions like this?
Chapter 10 Solutions
Elementary Statistics: A Step By Step Approach


- Find the equation of the regression line for the following data set. x 1 2 3 y 0 3 4arrow_forwardLife Expectancy The following table shows the average life expectancy, in years, of a child born in the given year42 Life expectancy 2005 77.6 2007 78.1 2009 78.5 2011 78.7 2013 78.8 a. Find the equation of the regression line, and explain the meaning of its slope. b. Plot the data points and the regression line. c. Explain in practical terms the meaning of the slope of the regression line. d. Based on the trend of the regression line, what do you predict as the life expectancy of a child born in 2019? e. Based on the trend of the regression line, what do you predict as the life expectancy of a child born in 1580?2300arrow_forwardFor the following exercises, consider the data in Table 5, which shows the percent of unemployed in a city ofpeople25 years or older who are college graduates is given below, by year. 41. Based on the set of data given in Table 7, calculatethe regression line using a calculator or othertechnology tool, and determine the correlationcoefficient to three decimal places.arrow_forward
 Functions and Change: A Modeling Approach to Coll...AlgebraISBN:9781337111348Author:Bruce Crauder, Benny Evans, Alan NoellPublisher:Cengage Learning
 Glencoe Algebra 1, Student Edition, 9780079039897...AlgebraISBN:9780079039897Author:CarterPublisher:McGraw Hill

 Algebra & Trigonometry with Analytic GeometryAlgebraISBN:9781133382119Author:SwokowskiPublisher:Cengage
 Calculus For The Life SciencesCalculusISBN:9780321964038Author:GREENWELL, Raymond N., RITCHEY, Nathan P., Lial, Margaret L.Publisher:Pearson Addison Wesley,