
Loose Leaf for Financial Accounting: Information for Decisions
9th Edition
ISBN: 9781260158762
Author: John J Wild
Publisher: McGraw-Hill Education
expand_more
expand_more
format_list_bulleted
Videos
Textbook Question
Chapter 1, Problem 2FSA
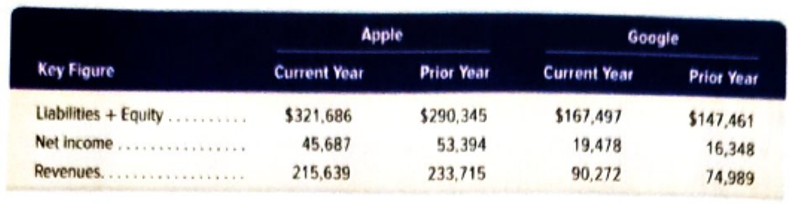
comparative figures ($ millions) for both Apple and Google follow.
Required
- What is the total amount of assets invested for the current year in (a) Apple and (b) Google?
- What is the current-year return on assets (a) Apple and (b) Google?
- How much are current-year expenses for (a) Apple and (b) Google?
- Is the current-year return on assets better than the return of competitors for (a) Apple and (b) Google?
- Relying only on return on assets, would we invest in Google or Apple?
Expert Solution & Answer
Want to see the full answer?
Check out a sample textbook solution
Students have asked these similar questions
What is the return on assets for Samsung in the (a) current year and (b) prior year?
Compute returns on assets for AT&T and Verizon and answer the question below. Be sure to show your work.
Key figures($ millions). AT&T Verizon
Sales 126,723 110,875
Net Income 4,184 10,198
Average Assets 269,868 225,233
AT&T
Verizon
Which company is more successful in returning net income from its assets invested?
Evaluating Business Segment Information
Hewlett-Packard Company reports that its "organizational structure is based on a number of
factors that management uses to evaluate, view and run its business operations." In its
disclosures of segment information, there are seven segments-Personal Systems, Printing,
Enterprise Group, Enterprise Services, Software, HP Financial Services, and Corporate
Investments. The company provides the following information about these business segments:
2014 2013
($ millions)
Total net revenue:
Personal Systems
Printing
Enterprise Group
Enterprise Services
Software
HP Financial Services
Corporate Investments
Earnings from operations:
Personal Systems
Printing
Enterprise Group
Enterprise Services
Software
HP Financial Services
Corporate Investments
Total assets:
Personal Systems
Printing
Enterprise Group.
Enterprise Services
Software
HP Financial Services
Corporate Investments
$34,303 $32,179
22,979 23,896
27,814 28,081
22,398 24,061
3,933 4,021
3,498 3,629…
Chapter 1 Solutions
Loose Leaf for Financial Accounting: Information for Decisions
Ch. 1 - Prob. 1DQCh. 1 - Technology is increasingly used to process...Ch. 1 - Identify four kinds of external users and describe...Ch. 1 - What are at least three questions business owners...Ch. 1 - Prob. 5DQCh. 1 - Describe the internal role of accounting for...Ch. 1 - Identify three types of services typically offered...Ch. 1 - Prob. 8DQCh. 1 - Why is accounting described as a service activity?Ch. 1 - What are some accounting-related professions?
Ch. 1 - Prob. 11DQCh. 1 - Prob. 12DQCh. 1 - What does the concept of objectivity imply for...Ch. 1 - Prob. 14DQCh. 1 - Prob. 15DQCh. 1 - Prob. 16DQCh. 1 - Define (a) assets, (b) liabilities, (c) equity,...Ch. 1 - Prob. 18DQCh. 1 - Prob. 19DQCh. 1 - What do accountants mean by the term revenue?Ch. 1 - Prob. 21DQCh. 1 - Prob. 22DQCh. 1 - Prob. 23DQCh. 1 - Prob. 24DQCh. 1 - Prob. 25DQCh. 1 - Prob. 26DQCh. 1 - Prob. 27DQCh. 1 - Define and explain return on assets.Ch. 1 - Define return and risk. Discuss the trade-off...Ch. 1 - Prob. 30DQCh. 1 - Prob. 31DQCh. 1 - Prob. 32DQCh. 1 - Choose from the following term or phrase a through...Ch. 1 - Prob. 2QSCh. 1 - Prob. 3QSCh. 1 - Identify each of the following terms or phrases as...Ch. 1 - Prob. 5QSCh. 1 - Prob. 6QSCh. 1 - Prob. 7QSCh. 1 - Prob. 8QSCh. 1 - Use Google's December 31. 2016, financial...Ch. 1 - Prob. 10QSCh. 1 - Prob. 11QSCh. 1 - Prob. 12QSCh. 1 - Prob. 13QSCh. 1 - Prob. 14QSCh. 1 - Prob. 15QSCh. 1 - Prob. 16QSCh. 1 - Prob. 17QSCh. 1 - Prob. 1ECh. 1 - Prob. 2ECh. 1 - Prob. 3ECh. 1 - Match each of the numbered descriptions I through...Ch. 1 - Prob. 5ECh. 1 - Enter the letter A through H for the principle or...Ch. 1 - Determine the missing amount from each of the...Ch. 1 - Prob. 10ECh. 1 - Prob. 11ECh. 1 - Prob. 12ECh. 1 - Prob. 13ECh. 1 - Prob. 14ECh. 1 - Prob. 15ECh. 1 - Use the information in Exercise 1-15 to prepare an...Ch. 1 - Prob. 17ECh. 1 - Prob. 18ECh. 1 - Prob. 19ECh. 1 - Prob. 20ECh. 1 - Prob. 21ECh. 1 - Prob. 22ECh. 1 - Prob. 23ECh. 1 - Identify how each of the following separate...Ch. 1 - Prob. 2PSACh. 1 - Prob. 3PSACh. 1 - Prob. 4PSACh. 1 - Prob. 5PSACh. 1 - Prob. 6PSACh. 1 - Gabi Gram started The Gram Co., a new business...Ch. 1 - Prob. 8PSACh. 1 - Sanyu Sony started a new business and completed...Ch. 1 - Prob. 10PSACh. 1 - Prob. 11PSACh. 1 - Prob. 12PSACh. 1 - Prob. 13PSACh. 1 - Prob. 14PSACh. 1 - Prob. 1PSBCh. 1 - Prob. 2PSBCh. 1 - Prob. 3PSBCh. 1 - Prob. 4PSBCh. 1 - Prob. 5PSBCh. 1 - Prob. 6PSBCh. 1 - Prob. 7PSBCh. 1 - Prob. 8PSBCh. 1 - Prob. 9PSBCh. 1 - Prob. 10PSBCh. 1 - Prob. 11PSBCh. 1 - Prob. 12PSBCh. 1 - Prob. 13PSBCh. 1 - Prob. 14PSBCh. 1 - On October 1, 2018, Santana Rey launched a...Ch. 1 - Prob. 1FSACh. 1 - comparative figures ($ millions) for both Apple...Ch. 1 - Prob. 3FSACh. 1 - Prob. 1BTNCh. 1 - Prob. 2BTNCh. 1 - Prob. 4BTNCh. 1 - Prob. 5BTNCh. 1 - Prob. 6BTN
Knowledge Booster


Learn more about
Need a deep-dive on the concept behind this application? Look no further. Learn more about this topic, accounting and related others by exploring similar questions and additional content below.Similar questions
- seeking investment for their development project. In which company would you invest The following table represents the annual trend of net profit of two different compane money, justify your Solution by using necessary statistical tool. Net profit in millions Company - A 16 32 Company - B 16 Year 2001 2002 2003 16 22 36 40 2004 2005 24 40 40 2006 2007 32 44 88 48arrow_forwardAttached is Apple Inc.'s financial information. Please answer questions 1-4. 1. Apple's working capital turnover in 2021 is a. 17.27 b. 19.18 c. 14.82 d. 15.35 2. Apple's days to sell inventory in 2021 is a. 8.99 b. 10.82 c. 9.73 d. 7.61 3. Apple's return on assets ratio in 2021 is a. 0.46 b. 0.37 c. 0.18 d. 0.29 4. Apple's times interest rate earned ratio in 2021 is a. 24.38 b. 19.36 c. 37.47 d. 42.21arrow_forwardProblem 1: Viance Queen Company Required: Compute for the company’s profitability and operating efficiency ratios for 2019 Compute for the financial health ratios of the company for 2019 A.Profitability ratio a. Return on Assets: ROA (NI/Total Assets) ROA (NI/Average Assets) ROA (EBIT/Total Assets) ROA (EBIT/Average Assets) ROE (NI/Capital) ROE (NI/Average Capitalarrow_forward
- (This is what is in between the 1st and 2nd screenshot) Using these data, determine the following: Earnings per share. Round your answer to two decimal places. Price-to-earnings ratio. Round your answer to two decimal places. Book value per share. Round your answer to two decimal places. Market-to-book ratio. Round your answer to two decimal places. EV-EBITDA multiple. Assume the cost of sales includes $14 million in depreciation expenses. Assume there are no amortization expenses. Round your answer to two decimal places. How much of the retained earnings total was added during Year 1? Enter your answer in millions. For example, an answer of $1.2 million should be entered as 1.2, not 1,200,000. Round your answer to two decimal places.$ million Show Eastland’s new balance sheet after the company sells 1 million new common shares in early Year 2 to net $28 a share. Part of the proceeds, $12 million, is used to reduce current liabilities, and the remainder is temporarily…arrow_forwardQuestion 2Alex is currently considering to invest his money in one of the companies between Company A and Company B. The summarized final accounts of the companies for their last completed financial year are as follows: a. Calculate the following ratios for Company A and Company B. State clearly the formulae used for each ratio: i. Gross Profit Marginii. Net Profit Marginiii. Inventory Turnover Period (days)iv. Receivables Collection Period (days)arrow_forwardlonic Exploration Company reported these figures for 2018 and 2017: E (Click the icon to view the figures.) Compute the rate of return on total assets for 2018. (Round to two decimals.) Select the formula, then enter the amounts to compute the rate of return on total assets for 2018. (Enter the rate of return as a percent rounded to two decimal places, X.XX%.) Rate of return on total assets %3D Data Table S: Income Statement-partial: 2018 2017 Interest Expense $ 17,800,000 $ 14,500,000 Net Income 18,400,000 14,600,000 Balance Sheet-partial: Dec. 31, 2018 Dec. 31, 2017 Total Assets $ 322,000,000 $ 320,000,000 Print Donearrow_forward
- Based on the quarter ended March 2023 financial results on investor.siriusxm.com, as per attached image and discuss whether Sirius XM's recent financial reports indicate that its business model is working. (i) Are its subscription fees increasing or declining? (ii) Are its revenue stream advertising and equipment sales growing or declining? (iii)Does its cost structure allow for acceptable profit marginsarrow_forwardVII. Direction: Compute and interpret. The following comparative financial statements are provided by Avatar Industries. You were asked to compute the different financial ratios and provide your interpretations with regards to profitability, efficiency, liquidity and solvency of the company. Use the Answer Sheet template below to input your answer and solution. AVATAR INDUSTRIES AVATAR INDUSTRIES Comparative Statement of Financial Position For the years 2019 and 2018 Comparative Income Statement For the years 2019 and 2018 2019 2018 2019 2018 ASSETS Current Assets: Sales P200,000 P210,000 Cash & Cash Equivalent P65,000 P70,000 Sales Returns and Allowances 40,000 25,000 Accounts Receivable 40,000 35,000 Net Sales 160,000 185,000 Marketable Secuities 40,000 35,000 Cost of Goods Sold 100,000 115,625 Inventory 100,000 80,000 Gross Profit 60,000 69,375 Total Current Assets 220,000 200,000 160,000 P445,000 P380,000 245,000 Operating Expenses: Fixed Assets Selling Expenses 22,000 25,000 Total…arrow_forwardProblem 1: Viance Queen Company Required: Compute for the company’s profitability and operating efficiency ratios for 2019 Compute for the financial health ratios of the company for 2019 A.Profitability ratio Return on Assets: ROA (EBIT/Average Assets) ROE (NI/Capital) ROE (NI/Average Capitalarrow_forward
- VII. Direction: Compute and interpret. The following comparative financial statements are provided by Avatar Industries. You were asked to compute the different financial ratios and provide your interpretations with regards to profitability, efficiency, liquidity and solvency of the company. Use the Answer Sheet template below to input your answer and solution. AVATAR INDUSTRIES AVATAR INDUSTRIES Comparative Statement of Financial Position For the years 2019 and 2018 Comparative Income Statement For the years 2019 and 2018 2019 2018 2019 2018 ASSETS Current Assets: Sales P200,000 P210,000 Cash & Cash Equivalent P65,000 P70,000 Sales Returns and Allowances 40,000 25,000 Accounts Receivable 40,000 35,000 Net Sales 160,000 185,000 Marketable Securities 40,000 35,000 Cost of Goods Sold 100,000 115,625 Inventory 100,000 80,000 Gross Profit 60,000 69,375 Total Current Assets 245,000 220,000 Operating Expenses: Fixed Assets 200,000 160,000 Selling Expenses 22,000 25,000 Total Assets P445,000…arrow_forwardThe 2024 income statement of Adrian Express reports sales of $20,310,000, cost of goods sold of $12,500,000, and net income of $1,900,000. Balance sheet information is provided in the following table. Assets Current assets: Cash Accounts receivable Inventory ADRIAN EXPRESS Balance Sheets December 31, 2024 and 2023 Long-term assets Total assets Liabilities and Stockholders' Equity Current liabilities Long-term Liabilities Common stock Retained earnings Total liabilities and stockholders' equity Industry averages for the following four risk ratios are as follows: Gross profit ratio Return on assets Profit margin Asset turnover Return on equity 45% 25% 15% 6.5 35% tines 2024 2023 $800,000 $910,000 1,725,000 1,175,000 2,175,000 1,625,000 5,000,000 4,390,000 $9,700,000 $8,100,000 $2,030,000 $1,820,000 2,490,000 2,560,000 2,025,000 1,975,000 3,155,000 1,745,000 $9,700,000 $8,100,000arrow_forwardPlease describe what is meant by “Times Interest Earned.” How is it calculated? Suppose you calculated this ratio for a company for two consecutive years and the results were the following: year 2018 – 24.0 year 2017 – 28.0 Please interpret the results. What conclusions can you draw?arrow_forward
arrow_back_ios
SEE MORE QUESTIONS
arrow_forward_ios
Recommended textbooks for you
 Financial AccountingAccountingISBN:9781305088436Author:Carl Warren, Jim Reeve, Jonathan DuchacPublisher:Cengage Learning
 Intermediate Financial Management (MindTap Course...FinanceISBN:9781337395083Author:Eugene F. Brigham, Phillip R. DavesPublisher:Cengage Learning
 Financial And Managerial AccountingAccountingISBN:9781337902663Author:WARREN, Carl S.Publisher:Cengage Learning,
Financial Accounting
Accounting
ISBN:9781305088436
Author:Carl Warren, Jim Reeve, Jonathan Duchac
Publisher:Cengage Learning
Intermediate Financial Management (MindTap Course...
Finance
ISBN:9781337395083
Author:Eugene F. Brigham, Phillip R. Daves
Publisher:Cengage Learning
Financial And Managerial Accounting
Accounting
ISBN:9781337902663
Author:WARREN, Carl S.
Publisher:Cengage Learning,
How To Analyze an Income Statement; Author: Daniel Pronk;https://www.youtube.com/watch?v=uVHGgSXtQmE;License: Standard Youtube License