
Videos
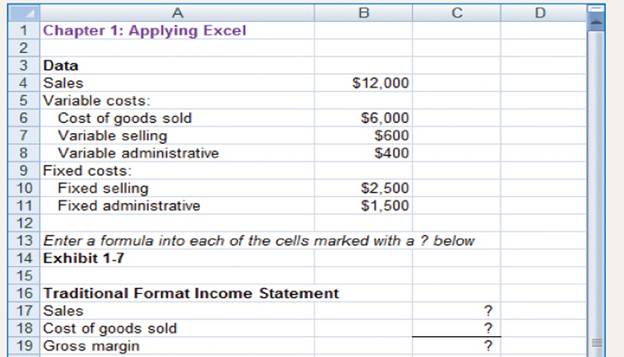
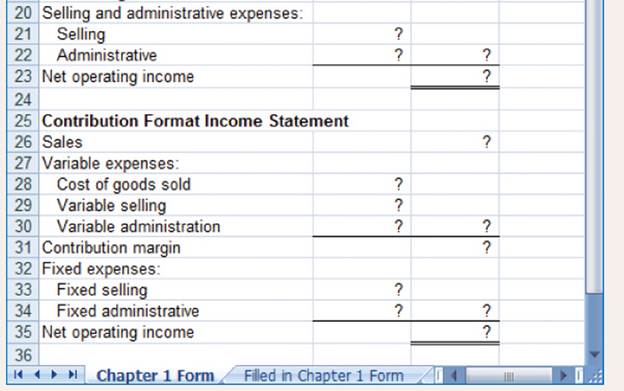
This Excel worksheet form is to be used to recreate Exhibit 1-7. Download the workbook containing this form from Connect, where you will also receive instructions.
2. Suppose that sales are 10% higher as shown below: 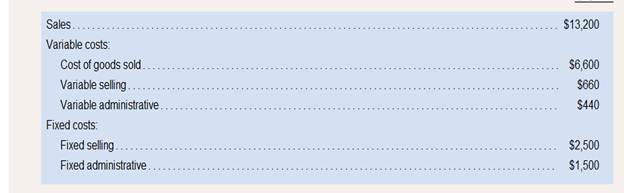
Enter this new data into your worksheet. Make sure that you change all of the data that are different-not just the sales. Print or copy the income statements from your worksheet.
What happened to the variable costs and to the fixed costs when sales increased by 10%? Why? Did the contribution margin increase by 10%? Why or why not? Did the net operating income increase by 10%? Why or why not?
Variable cost, fixed cost, contribution margin, net operating income:
Variable costs are directly related with production process, so it has the changes according to the sales revenue.
Fixed costs are indirectly related with production process, so it hasn’t change according to the sales revenue.
Contribution income is derived after deducting variable costs from sales revenue.
Net operating income is the real income for the company because it has derived after deduction all costs such as variable and fixed costs from sales revenue.
Whether increase of sales by 10% would change the variable costs and fixed costs.
Whether contribution margin increased or not by the new sales revenue (10%).
Whether net operating income increased or not by new sales revenue (10%).
Answer to Problem 2AE
Solution:
| Traditional format income statement |
|
|
| Particulars | Amount | Amount |
| Sales revenue | $13,200 | |
| Less | ||
| Cost of goods sold | $6,600 | |
| Gross margin | $6,600 | |
| Less: Selling and administration expenses | ||
| Selling expenses | $3160 | |
| Administration expenses | $1940 | $5100 |
| Net operating income | $1,500 |
| Contribution Format income statement | ||
| Particulars | Amount | Amount |
| Sales revenue | $13,200 | |
| Less: Variable expenses | ||
| Cost of goods sold | $6600 | |
| Variable selling | $660 | |
| Variable administration | $440 | $7,700 |
| Contribution margin | $5,500 | |
| Less: Fixed expenses | ||
| Selling expenses | $2,500 | |
| Administration Expenses | $1,500 | $4,000 |
| Net operating income | $1,500 |
Formula:
Explanation of Solution
Yes, new sales revenue increased the variable cost by 10%.
Old variable cost:
Increase variable cost:
New variable cost:
Yes, contribution margin increased by 10% due to new sales revenue, new variable costs, if variable
cost has change it reflect the contribution margin.
No, net operating income not increased by 10%, because fixed cost remain unchanged made the net
income increased up to 50%.
Old net operating income:
New net operating income:
Above explanation and calculation stated new sales revenue increased variable cost not the fixed cost and contribution margin also increased by 10% but net operating income not increased by 10%.
Want to see more full solutions like this?
Chapter 1 Solutions
Introduction To Managerial Accounting


- Using the data in E4-2 and spreadsheet software, determine: The variable cost per unit, the total fixed cost, and R2. The plotted data points using the graphing function. Compare the results to your solutions in E4-2 and E4-3 and explain the reasons for the results.arrow_forwardAn analyst has started preparing a spreadsheet as shown below. Column A contains the headings for various parameters and Column B contains the analyst's range names to be used in Excel. A 1 Price per Unit 2 Cost per Unit 3 Profit per Unit Price_per_Unit Cost per Unit Profit$_per_Unit 4. 5 Fixed Costs 6 Variable Costs Fixed Costs VariableCosts Label each of the following range names as "Correct" if is a valid range name in Excel or "Incorrect" if the range name is not valid for use in Excel. Proposed Range Name Price_per_Unit Cost per Unit Profit$_per_Unit Fixed Costs VariableCostsarrow_forward1. Call(35) = $9.12, Call(40) = $6.22, Call(45)= $4.08. Using MS Excel, create profit tables and graphs separately for each long call and then create a single chart showing profit for each long call on the same graph, clearly label each profit curve.arrow_forward
- Using the Microsoft 10K for the Fiscal Year ended June 30, 2018 to answer questions: 1. Interpret the results of 2018 "above the line" compared to 2017 "above the line" and then 2017 "below the line" and 2017 "below the line". 2. What is the revenue and cost streams of MSFT using the 10K. How are the costs allocated between the product and service streams? 3. What are the revenue recognition policy of MSFT?4. What are some examples of the revenue recognition for each area as mentioned in the report?5. What is the EBIT and EBITDA for MSFT for 2018 and 2017? How did you calculate this? 6. Using the MSFT financial statements, what is the variance for the balances listed below). The answer must include: % change from 2017 to 2018$ change from 2017 to 2018please state whether it is a favorable or unfavorable variance from 2017 to 2018 Cost of services Selling, general, administration and other Gross Profit of services Gross Profit of products 7. In the financial statement, what is the…arrow_forwardFill in the missing amounts in each of the following eight case situations. Treat each case independently. (Hint: One way to find the missing amounts would be to prepare a contribution margin income statement for each case, enter the known data, and then compute the missing items.) a. Assume that only one product is being sold in each of the following four case situations: (Negatlve omounts should be Indicated by a mlnus sign. Enter your contributlon margln answers as per unlt dollor values. Enter your answers rounded to the nearest whole number.) Fixed Еxpenses Net Income (Loss) Variable Contribution Case Units Sold Sales Expenses Margin 14,000 196,000 $9 per unit 46.000 1 106,600 $16 per unit 40% 31,500 59,400 15 10,000 3. 9,900 282,000 $31 per unit 104,000 (8,000) 4 b. Assume that more than one product is being sold in each of the following four case situations: (Negative omounts should be Indicated by a mlnus sign.) Average Contribution Margin (percentage) Variable Fixed Net Income…arrow_forwardZapo 1-2-3 is a top-selling electronic spreadsheet product. Zapo is about to release version 5.0. It divides its customers into two groups: new customers and upgrade customers (those who previously purchased Zapo 1-2-3, 4.0 or earlier versions). Although the same physical product is provided to each customer group, sizable differences exist in selling prices and variable marketing costs: E (Click the icon to view the price and cost information.) The fixed costs of Zapo 1-2-3 5.0 are $13,500,000. The planned sales mix in units is 60% new customers and 40% upgrade customers. Read the requirements. Requirement 1. What is the Zapo 1-2-3 5.0 breakeven point in units, assuming that the planned 60% / 40% sales mix is attained? Begin by determining the sales mix. For every bundle, units are sold to new customers, and units are sold to customer who bought upgrades. Data Table New Customers Upgrade Customers Selling price $ 225 $ 120 Variable costs Manufacturing $ 20 $ 20 60 80 25 Marketing $…arrow_forward
- You are creating part of an Excel model that will set the price of an item based on whether the customer is a preferred customer or not. The partially completed model in the attached file. <-- Click here to download the Excel file. In cell B6, you will enter the formula that will use this logic:When preferred status is Yes, the price is the preferred price. Otherwise the price is the regular price.= Answer ( Answer = "Yes" , Answer , Answer ) As an alternative, you could also use this logic to get the same results:When preferred status is No, the price is the regular price. Otherwise the price is the preferred price.= Answer ( Answer = "No" , Answer , Answer ) Note that these problems use short answer text boxes, and therefore can include any characters (not just numbers). Customer ID: 68YJW Prices: Regular $26.95 Customer Name Reggie Greene Preferred $21.95 Preferred? Y/N: Yes Customer Pricearrow_forwardHoward Cooper, the president of Vernon Computer Services, needs your help. He wonders about the potential effects on the firm's net income if he changes the service rate that the firm charges its customers. The following basic data pertain to fiscal Year 3. Standard rate and variable costs Service rate per hour Labor cost Overhead cost Selling, general, and administrative cost Expected fixed costs Facility maintenance Selling, general, and administrative Required A Required: a. Prepare the pro forma income statement that would appear in the master budget if the firm expects to provide 42,000 hours of services in Year 3. b. A marketing consultant suggests to Mr. Cooper that the service rate may affect the number of service hours that the firm can achieve. According to the consultant's analysis, if Vernon charges customers $83 per hour, the firm can achieve 52,000 hours of services. Prepare a flexible budget using the consultant's assumption. c. The same consultant also suggests that if…arrow_forwardRetail companies with today’s online, as well as in-store sales have a lot of data to keep track of! Keeping track of sales, costs, and profits daily is essential to making the most of a business. This exercise illustrates how to use the skills presented in this Module to generate the data needed daily by a retail company. Create the following calculated columns. a) In I4, and J4, use a VLOOKUP function that will look up the Product Price and Product Cost based on the Product Sold column which lists an ID number. [Hint: The Product Table sheet lists the Price and Cost] If any error messages appear, check the Range Lookup. b) In K4, use a formula to calculate Profit. Hint: Profit =(Product Price-Product Cost)*Units Sold Format columns I, J, and K as currency with two decimal places. Make a copy of the Sales sheet and rename it Online Sales by Date. Place this sheet to the right of the Sales sheet. Answer the following question by filtering the data accordingly. a) What was the…arrow_forward
- 1. Now change all of the dollar amounts in the data area of your worksheet so that it looks like this: Chapter 1: Applying Excel Data Sales $59,500 Variable costs: Cost of goods sold $34,000 Variable selling $3,400 Variable administrative $3,200 Fixed costs: Fixed selling $2,500 Fixed administrative $1,500 If your formulas are correct, you should get the correct answers to the following questions. (a) What is the gross margin now? (b) What is the net operating income now? (c) What is the contribution margin now?arrow_forwardPlease provide the average cost for each of 4 blanks. Please indicate answers CLEARLY. There should be 4 answers for each of the blanks. Also, please provide clear explanations of how you go your answers WITHOUT using Excel.arrow_forwardJPL, Inc. has provided its sales and expense data for the most recent period. The Controller has asked you prepare a spreadsheet that shows the related CVP Analysis computations. Use the information included in the Excel Simulation and the Excel functions described below to complete the task. • Cell Reference: Allows you to refer to data from another cell in the worksheet. From the Excel Simulation below, if in a blank cell, =B5" was entered, the formula would output the result from cell B5. or 75 in this example. • Beslc Math functlons: Allows you to use the basic math symbols to perform mathematical functions. You can use the following keys: - (plus sign to add). - (minus sign to subtract). * (asterisk sign to multiply). and / (forward slash to divide). From the Excel Simulation below, if in a blank cell "=85+B6" was entered, the formula would add the values from those cells and output the result, or 120 in this example. If using the other math symbols the result would output an…arrow_forward
 Principles of Cost AccountingAccountingISBN:9781305087408Author:Edward J. Vanderbeck, Maria R. MitchellPublisher:Cengage Learning
 Essentials Of Business AnalyticsStatisticsISBN:9781285187273Author:Camm, Jeff.Publisher:Cengage Learning,