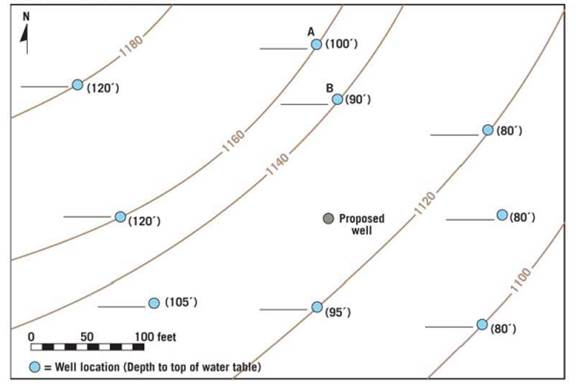
Calculate the elevation of the water table at each well location and write the approximate elevation on the line next to each well. Next, use a colored pencil to draw smooth 10-foot contours that show the shape of the water table. (Start with the 1160-foot contour.) Use a pencil of a different color to draw arrows on the map to indicate the direction of the slope of the water table.
| a. | Toward which direction (downward) does the water table slope? |
| b. | Referring to the site of the proposed water well, at approximately what depth below the surface should the proposed well intersect the water table? |

Learn your wayIncludes step-by-step video

Chapter 8 Solutions
Applications and Investigations in Earth Science (9th Edition)
Additional Science Textbook Solutions
Chemistry: An Introduction to General, Organic, and Biological Chemistry (13th Edition)
Living By Chemistry: First Edition Textbook
Human Anatomy & Physiology (2nd Edition)
Anatomy & Physiology (6th Edition)
Physics for Scientists and Engineers: A Strategic Approach, Vol. 1 (Chs 1-21) (4th Edition)
The Cosmic Perspective (8th Edition)

- How does Gateway Community College or Norwalk, CT deal with solid waste? Can solid waste production be limited at your institution or city? How? What barriers exist that might make it difficult to limit solid waste production?arrow_forwardIt is possible to have a high standard of living, as in North America and Western Europe, and not produce large amounts of solid waste. How?arrow_forwardHow is lifestyle related to the quantity of municipal solid waste generated?arrow_forward
- What conditions favor incineration over landfills?arrow_forwardDescribe some of the problems associated with modern landfills.arrow_forwardIM 4G III. > Homework 1 ۲:۱۱ ٢ من ٣ Contouring (EXERCISES) Contour the following data and complete the two profiles .0 3 16 25 2117 12 2 .° 15 O 25 35 5 11 .41 20 18 31 43 16 15 4342 19 21 29 40 .30 13 12 .0 5 29 12 19 2 22 +4 15 2 110 9 D .º B' Turtle Island 0arrow_forward
- 1. What is the contour interval of this map?Contour interval: ____ feet 2. What is the difference in elevation from one index contour to the next?Difference in elevation:____feet 3. On most quadrangles, each section is numbered in red and outlined in red or, occasionally, dashed black lines. Find Section 9, located near the center of the map, and measure its width and length in milesusing the bar scale provided.Sections are _____ miles(s) wide and ____mile(s) long 4. Locate the small intermittent stream (blue dashed line) just below the red number 9 that denotes Section 9. Toward what general direction does the stream flow? Explain how you arrived at your answer.Direction of stream flow: ____Explain: ______ 5. What is the approximate elevation of the point marked with an X in Section 8?Elevation of X _____ feet 6. What is the approximate relief between point X and the surface of Turquoise Lake?Relief:____feet 7. Which of the following phrases best describes the topography of Tennessee…arrow_forward1. The difference in elevation between adjacent contour lines is called the contour interval. Look at the bottom of this map to identify the contour interval.Contour interval: ________ 2. What is the difference in elevation between Points A and B?Difference in elevation: _____ feet 3. Notice that every fifth contour line, called an index contour, is printed as a bold brown line, and the elevation of that line is provided (in feet). List the elevations for each index contour shown on this map._____________ feet, ___________ feet,___________feet 4. Closely spaced contours indicate steep slopes. Which of the four slopes shown with red arrows labeled 1-4 is the steepest? Which is the least steep?Steepest: _______Least steep: _____ 5. One or more roughly circular closed contours indicate a hill. Which of the landforms labeled B-E are hills?Hill landforms: ______ 6. Closed contours with hachures (short lines) that point downslope indicate depressions (basins without outlets). Which of the…arrow_forward1. Use the PLS system to label the townships along the western edge and ranges along the bottom of Part A. 2. Use the PLS system to label each of the sections in the congressional township shown in Part B. 3. In the space provided below, use the PLS system to describe Plots Y and Z. Plot X has been completed as an example.arrow_forward
 Applications and Investigations in Earth Science ...Earth ScienceISBN:9780134746241Author:Edward J. Tarbuck, Frederick K. Lutgens, Dennis G. TasaPublisher:PEARSON
 Exercises for Weather & Climate (9th Edition)Earth ScienceISBN:9780134041360Author:Greg CarbonePublisher:PEARSON
 Environmental ScienceEarth ScienceISBN:9781260153125Author:William P Cunningham Prof., Mary Ann Cunningham ProfessorPublisher:McGraw-Hill Education
 Earth Science (15th Edition)Earth ScienceISBN:9780134543536Author:Edward J. Tarbuck, Frederick K. Lutgens, Dennis G. TasaPublisher:PEARSON
 Environmental Science (MindTap Course List)Earth ScienceISBN:9781337569613Author:G. Tyler Miller, Scott SpoolmanPublisher:Cengage Learning
 Physical GeologyEarth ScienceISBN:9781259916823Author:Plummer, Charles C., CARLSON, Diane H., Hammersley, LisaPublisher:Mcgraw-hill Education,