
Linear Algebra: A Modern Introduction
4th Edition
ISBN: 9781285463247
Author: David Poole
Publisher: Cengage Learning
expand_more
expand_more
format_list_bulleted
Related questions
Question
Please solve this question
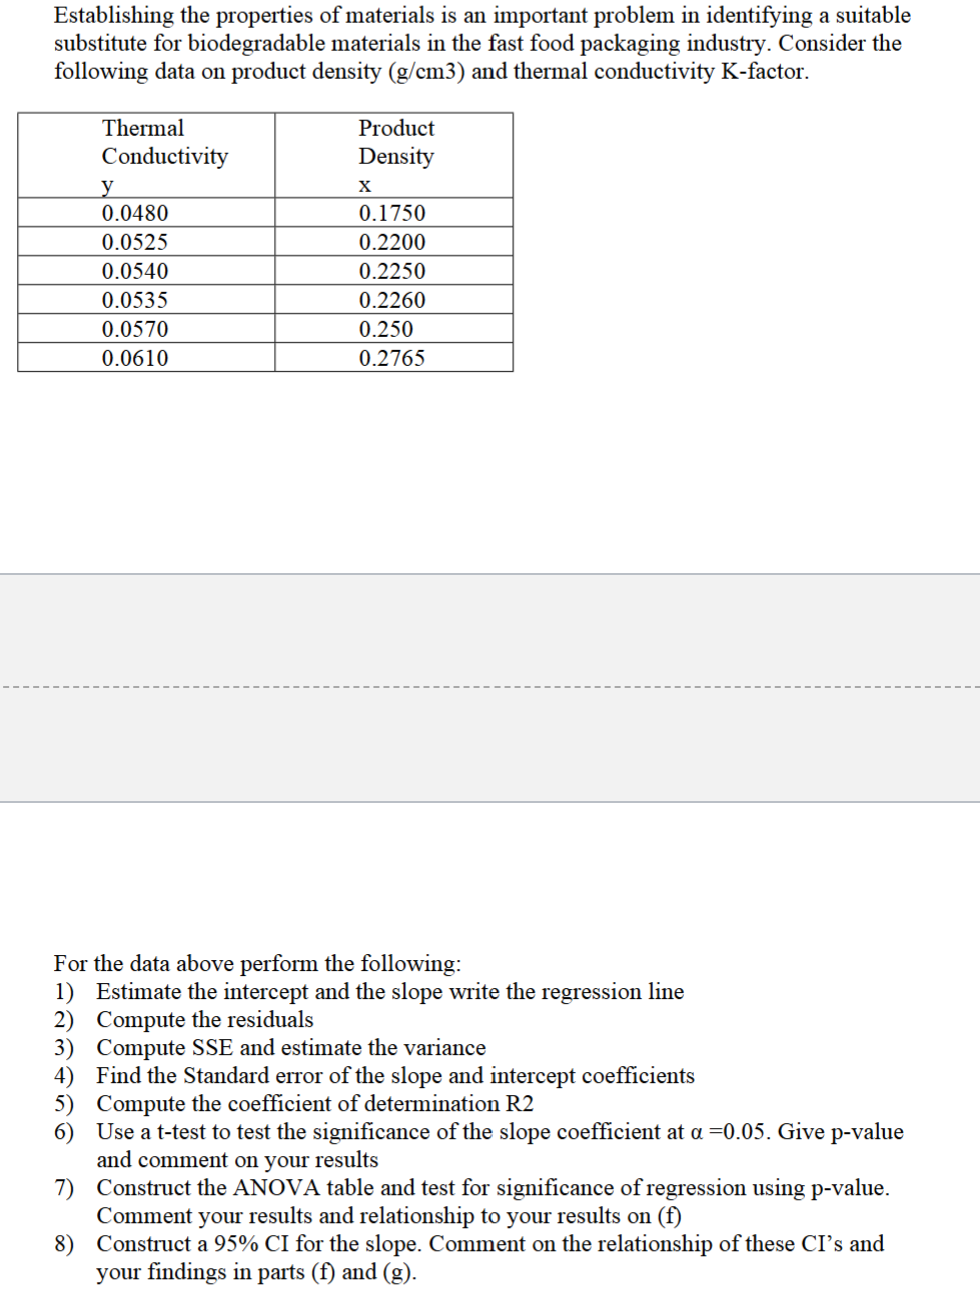

Transcribed Image Text:Establishing the properties of materials is an important problem in identifying a suitable
substitute for biodegradable materials in the fast food packaging industry. Consider the
following data on product density (g/cm3) and thermal conductivity K-factor.
Thermal
Conductivity
y
Product
Density
X
0.0480
0.1750
0.0525
0.2200
0.0540
0.2250
0.0535
0.2260
0.0570
0.250
0.0610
0.2765
For the data above perform the following:
1) Estimate the intercept and the slope write the regression line
2) Compute the residuals
3) Compute SSE and estimate the variance
4) Find the Standard error of the slope and intercept coefficients
5) Compute the coefficient of determination R2
6) Use a t-test to test the significance of the slope coefficient at a =0.05. Give p-value
and comment on your results
7) Construct the ANOVA table and test for significance of regression using p-value.
Comment your results and relationship to your results on (f)
8) Construct a 95% CI for the slope. Comment on the relationship of these CI's and
your findings in parts (f) and (g).
Expert Solution
This question has been solved!
Explore an expertly crafted, step-by-step solution for a thorough understanding of key concepts.

Step by stepSolved in 2 steps with 3 images

Knowledge Booster

Similar questions
- Wrinkle recovery angle and tensile strength are the two most important characteristics for evaluating the performance of crosslinked cotton fabric. An increase in the degree of crosslinking, as determined by ester carboxyl band absorbance, improves the wrinkle resistance of the fabric (at the expense of reducing mechanical strength). The accompanying data on x = absorbance and y = wrinkle resistance angle was read from a graph in the paper "Predicting the Performance of Durable Press Finished Cotton Fabric with Infrared Spectroscopy".† x 0.115 0.126 0.183 0.246 0.282 0.344 0.355 0.452 0.491 0.554 0.651 y 334 342 355 363 365 372 381 392 400 412 420 Here is regression output from Minitab: Predictor Constant absorb S = 3.60498 Coef 321.878 156.711 SOURCE Regression Residual Error Total SE Coef 2.483 6.464 R-Sq = 98.5% DF 1 9 10 SS 7639.0 117.0 7756.0 T 129.64 24.24 0.000 0.000 R-Sq (adj) = 98.3% MS 7639.0 13.0 F P 587.81 (a) Does the simple linear regression model appear to be…arrow_forwardWrinkle recovery angle and tensile strength are the two most important characteristics for evaluating the performance of crosslinked cotton fabric. An increase in the degree of crosslinking, as determined by ester carboxyl band absorbance, improves the wrinkle resistance of the fabric (at the expense of reducing mechanical strength). The accompanying data on x = absorbance and y = wrinkle resistance angle was read from a graph in the paper "Predicting the Performance of Durable Press Finished Cotton Fabric with Infrared Spectroscopy".t 半 0.115 0.126 0.183 0.246 0.282 0.344 0.355 0.452 0.491 0.554 0.651 334 342 355 363 365 372 381 392 400 412 420 Here is regression output from Minitab: Predictor Coef SE Coef P Constant 321.878 2.483 129.64 0.000 absorb 156.711 6.464 24.24 0.000 S = 3.60498 R-Sq = 98.5% R-Są (adj) - 98.3% SOURCE DF MS F P Regression 1 7639.0 7639.0 587.81 0.000 Residual Error 9 117.0 13.0 Total 10 7756.0 (a) Does the simple linear regression model appear to be…arrow_forwardWrinkle recovery angle and tensile strength are the two most important characteristics for evaluating the performance of crosslinked cotton fabric. An increase in the degree of crosslinking, as determined by ester carboxyl band absorbance, improves the wrinkle resistance of the fabric (at the expense of reducing mechanical strength). The accompanying data on x = absorbance and y = wrinkle resistance angle was read from a graph in the paper "Predicting the Performance of Durable Press Finished Cotton Fabric with Infrared Spectroscopy".t x 0.115 0.126 0.183 0.246 0.282 0.344 0.355 0.452 0.491 0.554 0.651 y 334 342 355 363 365 372 381 400 392 412 420 Here is regression output from Minitab: Predictor Constant absorb S = 3.60498 Coef 321.878 156.711 SOURCE Regression Residual Error Total R-Sq= 98.5% DF SE Coef 2.483 6.464 1 9 10 SS 7639.0 117.0 7756..0 T 129.64 24.24 P 0.000 0.000. R-Sq (adj) 98.3% MS 7639.0 13.0 F 587.81 (a) Does the simple linear regression model appear to be appropriate?…arrow_forward
- Chlorophylls a and b are plant pigments that absorb sunlight and transfer the energy into photosynthesis of carbohydrates from CO2 and H2O, releasing O2 in the process. Chlorophylls were extracted from chopped up grass and measured by spectrophotometry. The table shows results for chlorophyll a for four separate analysis of five blades of grass. Chlorophyll a (g/L) Blade 1 Blade 2 Blade 3 Blade 4 Blade 5 1.09 1.26 1.1 1.23 0.85 0.86 0.96 1.21 1.3 0.65 0.93 0.8 1.27 0.97 0.86 0.99 0.73 1.12 0.97 1.03 Four replicate measurements for each blade of grass tell us the precision of the analytical procedure (sanalysis). Differences between mean values for each of the five blades of grass are a measure of variation due to sampling (ssampling). Using Excel and it’s ANOVA function, find the standard deviations attributable to sampling and to analysis, as well as the overall standard deviation arising from both sources.arrow_forwardLaetisaric acid is a compound that holds promise for control of fungus diseases in crop plants. The accompanying data show the results of growing the fungus Pythium (y) in various concentrations of laetisaric acid (x). Laetisaric acid concentration (uG/mL) Fungus growth (mm) 0. 33.3 31.0 29.8 27.8 6. 28.0 6. 29.0 10 25.5 10 23.8 20 18.3 20 15.5 30 11.7 30 10.0 Mean 11.500 23.642 Standard deviation 10.884 7.8471 T =-0.98754 %3D a. State the linear regression equation, and with a 0.01 level of significance, predict the amount (in mm) of fungus growth when 25 uG/mL laetisaric acid is applied. Assume the pairs of data follow a bivariate normal distribution and that the scatterplot shows no evidence of a non-linear relationship in the data. b. Determine the percentage of the variation in fungus growth that is explained by the linear relationship between laetisaric acid concentration and fungus growth. Attack Eilarrow_forwardThe euphotic zone is the upper 200 m layer of the oceans. Very little sunlight penetrates deeper than 200 m, so most plants live in the euphotic zone. As a result, 70% of all photosynthesis on Earth occurs in the euphotic zone of the oceans. The following table gives light penetration data for the location in the Pacific Ocean. Depth (m) Penetration of Sunlight (%) 0.01 100 20 54.37 40 29.57 60 16.08 80 8.74 100 4.76 a. Determine the equation of the logarithmic regression by using LOG or LN function on your TI-83 Plus graphic calculator. b. Using your equation obtained from a), determine the depth with a sunlight penetration of 35%. Express your answer to the nearest tenth of meter.arrow_forward
- i have attached a picturearrow_forwardNonpoint source loads are chemical masses that travel to the main stem of a river and its tributaries in flows that are distributed over relatively long stream reaches, in contrast to those that enter at well-defined and regulated points. An article suggests that for a certain time period and location, X = nonpoint source load of total dissolved solids could be modeled with a lognormal distribution having mean value 10,249 kg/day/km and a coefficient of variation CV = 0.40 (cv = 'x Hx' In USE SALT (a) What are the mean value and standard deviation of In(X)? (Round your answers to four decimal places.) mean value standard deviation (b) What is the probability that X is at most 15,000 kg/day/km? (Round your answer to four decimal places.) (c) What is the probability that X exceeds its mean value? (Round your answer to four decimal places.) Why is this probability not 0.5? Since the lognormal distribution --Select-- v a symmetric distribution, the mean and the median of X --Select--- v…arrow_forwardNonpoint source loads are chemical masses that travel to the main stem of a river and its tributaries in flows that are distributed over relatively long stream reaches, in contrast to those that enter at well-defined and regulated points. An article suggests that for a certain time period and location, X nonpoint source load of total dissolved solids could be modeled with a lognormal distribution having mean value 10,647 kg/day/km and a coefficient of variation CV = 0.40 (CV = ох MX = USE SALT (a) What are the mean value and standard deviation of In(X)? (Round your answers to four decimal places.) mean value standard deviation (b) What is the probability that X is at most 15,000 kg/day/km? (Round your answer to four decimal places.) (c) What is the probability that X exceeds its mean value? (Round your answer to four decimal places.) Why is this probability not 0.5? Since the lognormal distribution is not ✓a symmetric distribution, the mean and the median of X are not ✓the same and, in…arrow_forward
- Pls show work so I can understandarrow_forwardi) Compute the value of X in Table 2. ii) Estimate mass that dissolved in the water if the temperature is set at 100 Celcius.arrow_forwardSTAT 3128 Homeowrk Section 8.1 - 8.3. Question 1. An article reports the following values for soil heat flux of eight plots covered with coal dust. 34.8 33.7 34.8 35.3 33.3 28.5 18.3 24.6 The mean soil heat flux for plots covered only with grass is 25. Assuming that the heat flux distribution is normal, does the data suggest that the coal dust is effective in increasing the mean heat flux over that for grass? Test the appropriate hypotheses at the significance level 0.05 (a) State the appropriate null and alternative hypotheses. (b) State the distribution of the test statistic and calculate its value. (c) Calculate the p-value or find the critical value for this test. (d) State the conclusion: either reject the null hypothesis or fail to reject the null hypothesis.arrow_forward
arrow_back_ios
SEE MORE QUESTIONS
arrow_forward_ios
Recommended textbooks for you
- Linear Algebra: A Modern IntroductionAlgebraISBN:9781285463247Author:David PoolePublisher:Cengage Learning
Linear Algebra: A Modern Introduction
Algebra
ISBN:9781285463247
Author:David Poole
Publisher:Cengage Learning