
Cornerstones of Financial Accounting
4th Edition
ISBN: 9781337690881
Author: Jay Rich, Jeff Jones
Publisher: Cengage Learning
expand_more
expand_more
format_list_bulleted
Question
Please explain the answers step by step
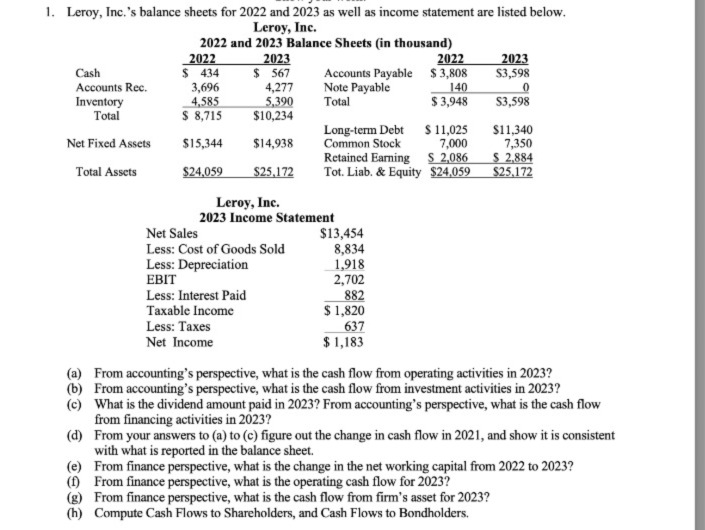

Transcribed Image Text:1. Leroy, Inc.'s balance sheets for 2022 and 2023 as well as income statement are listed below.
Leroy, Inc.
2022 and 2023 Balance Sheets (in thousand)
2022
2023
2022
2023
Cash
Accounts Rec.
$ 434
$ 567
Accounts Payable $3,808
$3,598
3,696
4,277
Note Payable
140
Inventory
4,585
5,390
Total
$3,948
$3,598
Total
$ 8,715
$10,234
Long-term Debt
$ 11,025
$11,340
Net Fixed Assets
$15,344
$14,938
Common Stock
7,000
7,350
Retained Earning
S 2,086
$ 2,884
Total Assets
$24,059
$25,172
Tot. Liab. & Equity $24,059
$25,172
Leroy, Inc.
Net Sales
2023 Income Statement
Less: Cost of Goods Sold
Less: Depreciation
EBIT
Less: Interest Paid
Taxable Income
Less: Taxes
Net Income
$13,454
8,834
1,918
2,702
882
$ 1,820
637
$1,183
(a) From accounting's perspective, what is the cash flow from operating activities in 2023?
(b) From accounting's perspective, what is the cash flow from investment activities in 2023?
(c) What is the dividend amount paid in 2023? From accounting's perspective, what is the cash flow
from financing activities in 2023?
(d) From your answers to (a) to (c) figure out the change in cash flow in 2021, and show it is consistent
with what is reported in the balance sheet.
(e) From finance perspective, what is the change in the net working capital from 2022 to 2023?
(f) From finance perspective, what is the operating cash flow for 2023?
(g) From finance perspective, what is the cash flow from firm's asset for 2023?
(h) Compute Cash Flows to Shareholders, and Cash Flows to Bondholders.
Expert Solution
This question has been solved!
Explore an expertly crafted, step-by-step solution for a thorough understanding of key concepts.

Step by stepSolved in 2 steps with 36 images

Knowledge Booster

Similar questions
- Prepare a ratio analysis ( Conclusion only) on each statementarrow_forwardSuppose McDonald's 2022 financial statements contain the following selected data (in millions). Current assets Total assets Current liabilities Total liabilities (a1) a. b. Compute the following values. C. $3,416.0 Interest expense 30,224.0 d. 2,988.0 16,191.0 Income taxes Net income $473.0 1,936.0 4,551.0 Current ratio. (Round to 2 decimal places, e.g. 6.25:1.) Working capital. (Round to 1 decimal place, e.g. 5,275.5) Debt to assets ratio. (Round to 0 decimal places, e.g. 62%.) Times interest earned. (Round to 2 decimal places, e.g. 6.25.) millions :1 % timesarrow_forwardJust Dew It Corporation reports the following balance sheet information for 2020 and 2021. JUST DEW IT CORPORATION 2020 and 2021 Balance Sheets Liabilities and Owners' Equity Current liabilities Accounts payable Notes payable 2020 2021 $ 43,500 $48,240 29,625 32,160 Assets 2020 2021 Current assets Cash $ 8,250 $ 12,240 Accounts receivable 34,500 40,560 Inventory 58,500 86,160 Total $101,250 $ 138,960 Total es Long-term debt Owners' equity $ 73,125 $ 80,400 $ 45,000 $ 36,000 Common stock and paid-in surplus $60,000 $60,000 Retained earnings 196,875 303,600 $ Net plant and equipment $273,750 $341,040 Total $ 256,875 363,600 $ Total assets $375,000 480,000 Total liabilities and owners' equity $ $375,000 480,000 Prepare the 2020 and 2021 common-size balance sheets for Just Dew It. (Do not round intermediate calculations and enter your answers as a percent rounded to 2 decimal places, e.g., 32.16.)arrow_forward
- Carla Vista Co. has these comparative balance sheet data: CARLA VISTA CO.Balance SheetsDecember 31 2022 2021 Cash $ 16,140 $ 32,280 Accounts receivable (net) 75,320 64,560 Inventory 64,560 53,800 Plant assets (net) 215,200 193,680 $371,220 $344,320 Accounts payable $ 53,800 $ 64,560 Mortgage payable (15%) 107,600 107,600 Common stock, $10 par 150,640 129,120 Retained earnings 59,180 43,040 $371,220 $344,320 Additional information for 2022: 1. Net income was $32,500. 2. Sales on account were $392,900. Sales returns and allowances amounted to $27,300. 3. Cost of goods sold was $217,300. 4. Net cash provided by operating activities was $57,200. 5. Capital expenditures were $30,000, and cash dividends were $19,000. Compute the following ratios at December 31, 2022. (Round current ratio and inventory turnover to 2 decimal…arrow_forwardThe comparative balance sheets for 2024 and 2023 and the statement of income for 2024 are given below for Dux Company. Additional information from Dux's accounting records is provided also. DUX COMPANY Comparative Balance Sheets December 31, 2024 and 2023 ($ in thousands) 2024 2023 Assets Cash $ 121 $ 40 Accounts receivable 43 71 Less: Allowance for uncollectible accounts (5) (4) Dividends receivable 4 3 Inventory 100 95 Long-term investment 54 50 Land 95 85 Buildings and equipment 162 200 Less: Accumulated depreciation (38) (80) $ 536 $ 460 Liabilities Accounts payable $ 46 $ 82 Salaries payable 6 9 Interest payable 7 2 Income tax payable 5 6 Notes payable 10 0 Bonds payable 80 50 Less: Discount on bonds (5) (6) Shareholders' Equity Common stock 210 200 Paid-in capital—excess of par 24 20 Retained earnings 163 97 Less: Treasury stock (10) 0 $ 536 $ 460 DUX COMPANY Income Statement For the Year…arrow_forwardSuppose the 2022 Adidas financial statement contain the following selected data (in millions) current assets 4215 total assets 9000 current liabilities 4860 cash 755 interest expense 150 income tax 190 net income 275 a.working capital b.current ratio c.debt to assets ratio d.times interest earenedarrow_forward
- 5) Consider the following financial statement information for the ABC Corporation: Account 2018 2019 Cash $7,516 26,547 10,808 12,416 1,000 $133,844 $16,195 $85,733 $6,424 $10,697 36,986 13,110 13,555 1,200 $151,611 S16,177 $100,063 $6,520 Inventory Accounts Receivable Accounts Payable Notes Payable Net Revenue Net Income Cost of Goods Sold Depreciation Expense a) Calculate the cash conversion efficiency for 2018 and 2019. b) Calculate the net liquid balance for 2018 and 2019. c) Based on each of these measures, is the company more or less liquid in 2019 that it was in 2018? Explain. d) Determine the cash conversion period and the operating cycle for both years. e) Do the cash conversion cycle and operating cycle values suggest that there is a problem management needs to address? If so, explain what it is and what you can to do about it.arrow_forwardThe comparative balance sheet of Merrick Equipment Co. for Dec. 31, 20Y9 and 20Y8, is:Dec. 31, 20Y9 Dec. 31, 20Y8AssetsCash $70,720 $47,940Accounts receivable (net) 207,230 188,190Inventories 298,520 289,850Investments 0 102,000Land 295,800 0Equipment 438,600 358,020Accumulated depreciation—equipment (99,110) (84,320)Total assets $1,211,760 $901,680Liabilities and Stockholders' EquityAccounts payable (merchandise creditors) $205,700 $194,140Accrued expenses payable (operating expenses) 30,600 26,860Dividends payable 25,500 20,400Common stock, $1 par 202,000 102,000Paid-in capital: Excess of issue price over par—common stock 354,000 204,000Retained earnings 393,960 354,280Total liabilities and stockholders' equity $1,211,760 $901,680The income statement for the year ended December 31, 20Y9, is as follows:Sales $2,023,898Cost of goods sold 1,245,476Gross profit $778,422Operating expenses:Depreciation expense $14,790Other operating expenses 517,299Total operating expenses 532,089Operating…arrow_forwardThe current assets and liabilities sections of the comparative balance sheets of Regent Inc., a private entity reporting under ASPE, at December 31 are presented below, along with the income statement: REGENT INC. Comparative Balance Sheet Accounts 2024 2023 Cash $27,720 $29,400 Accounts receivable 17,920 11,480 Inventory 9,100 12,880 Prepaid expenses 2,100 1,624 Accounts payable 12,040 10,080 Accrued expenses payable 1,400 2,240 Dividends payable 6,720 4,760 Income tax payable 1,904 3,304 REGENT INC. Income Statement Year Ended October 31, 2024 Sales $175,000 Cost of goods sold 109,200 Gross profit 65,800 Operating expenses $24,640 Depreciation expense 6,440 Loss on sale of equipment 2,240 33,320 Profit before income tax 32,480 Income tax expense 8,120 Profit for the year $24,360 Instructions Prepare the operating section of the cash flow statement using the direct method.arrow_forward
- Please answer question 16-18 based on the following information from Owl Inc. Income Statement Sales COGS SGA Depreciation EBIT Interest E BT Taxes (35%) Net income Dividend payout a. b. Cash Accounts receivable Inventory Current assets Net fixed assets Total assets Net fixed assets Balance Sheet as of December 31, 2019 22,228 Accounts payable 19,450 Cash Accounts receivable Inventory Current assets 25,495 67,173 Less than $50,000 Between $65,000 and $75,000 C. Between $75,000 and $85,000 d. Between $85,000 and $100,000 205,000 272,173 Total assets 310,029 16. How much is the operating cash flow in 2020? 2019 2020 277,855 333,426 141,641 175,049 27,786 38,344 38,900 46,680 69,528 73,353 4,356 68,997 24,149 44,848 35% 221,671 4,275 65,253 22,839 42,414 50% Balance Sheet as of December 31, 2020 26,674 Accounts payable 26,674 Notes payable 35,010 Current liabilities 88,358 Notes payable Current liabilities Long-term debt Owner's equity Total liab & equity Long-term debt Owner's equity…arrow_forwardFor Items 9-10 Following are selected financial and operating data taken from the financial statements of Alamona Corporation: Cash Notes and Accounts Receivable, net Merchandise Inventory Marketable Securities short-term Land and Buildings (net) Bonds Payable long-term Accounts Payable - trade Notes Payable - short-term As of December 31 2023 2022 80,000 640,000 400,000 1,200,000 720,000 1,200,000 240,000 80,000 2,720,000 2,880,000 2,160,000 2,240,000 560,000 880,000 160,000 320,000 Sales (20% cash, 80% credit sales) Cost of Goods Sold For the Year-Ended December 31 2023 18,400,000 8,000,000 2022 19,200,000 11,200,000 Compute for the following ratio: 9. Current ratio as of December 31, 2023 a. 0.5:1 b. 2.0:1 c. 2.6:1 d. 3.2:1 10. Quick (acid test) ratio as of December 31, 2023 a. 2.0 to 1 b. 0.5 to 1 c. 1 to 1 d. 0.7 to 1 Page 4 of 4arrow_forwardJust Dew It Corporation reports the following balance sheet information for 2020 and 2021. JUST DEW IT CORPORATION 2020 and 2021 Balance Sheets Assets 2020 2021 Liabilities and Owners' Equity 2020 2021 Current assets Current liabilities Cash $ 10, 620 $ 13, 275 Accounts payable $ 52, 560 $ 60, 750 Accounts receivable 21,420 29, 925 Notes payable 19, 260 24,075 Inventory 67, 860 82, 575 Total $ 99,900 $ 125, 775 Total $ 71,820 $ 84, 825 Long-term debt $ 36,000 $ 27,000 Owners' equity Common stock and paid - in surplus $ 45,000 $ 45,000 Retained earnings 207, 180 293, 175 Net plant and equipment $ 260, 100 $ 324, 225 Total $ 252, 180 $ 338, 175 Total assets $ 360,000 $ 450,000 Total liabilities and owners' equity $ 360,000 $ 450,000 For each account on this company's balance sheet, show the change in the account during 2021 and note whether this change was a source or use of cash. (If there is no action select "None" from the dropdown options. Leave no cells blank - be certain to enter…arrow_forward
arrow_back_ios
SEE MORE QUESTIONS
arrow_forward_ios
Recommended textbooks for you
- Cornerstones of Financial AccountingAccountingISBN:9781337690881Author:Jay Rich, Jeff JonesPublisher:Cengage Learning
Cornerstones of Financial Accounting
Accounting
ISBN:9781337690881
Author:Jay Rich, Jeff Jones
Publisher:Cengage Learning