
Curren'S Math For Meds: Dosages & Sol
11th Edition
ISBN: 9781305143531
Author: CURREN
Publisher: Cengage
expand_more
expand_more
format_list_bulleted
Related questions
Question
Kinetics: One-Compartment First-Order Absorption
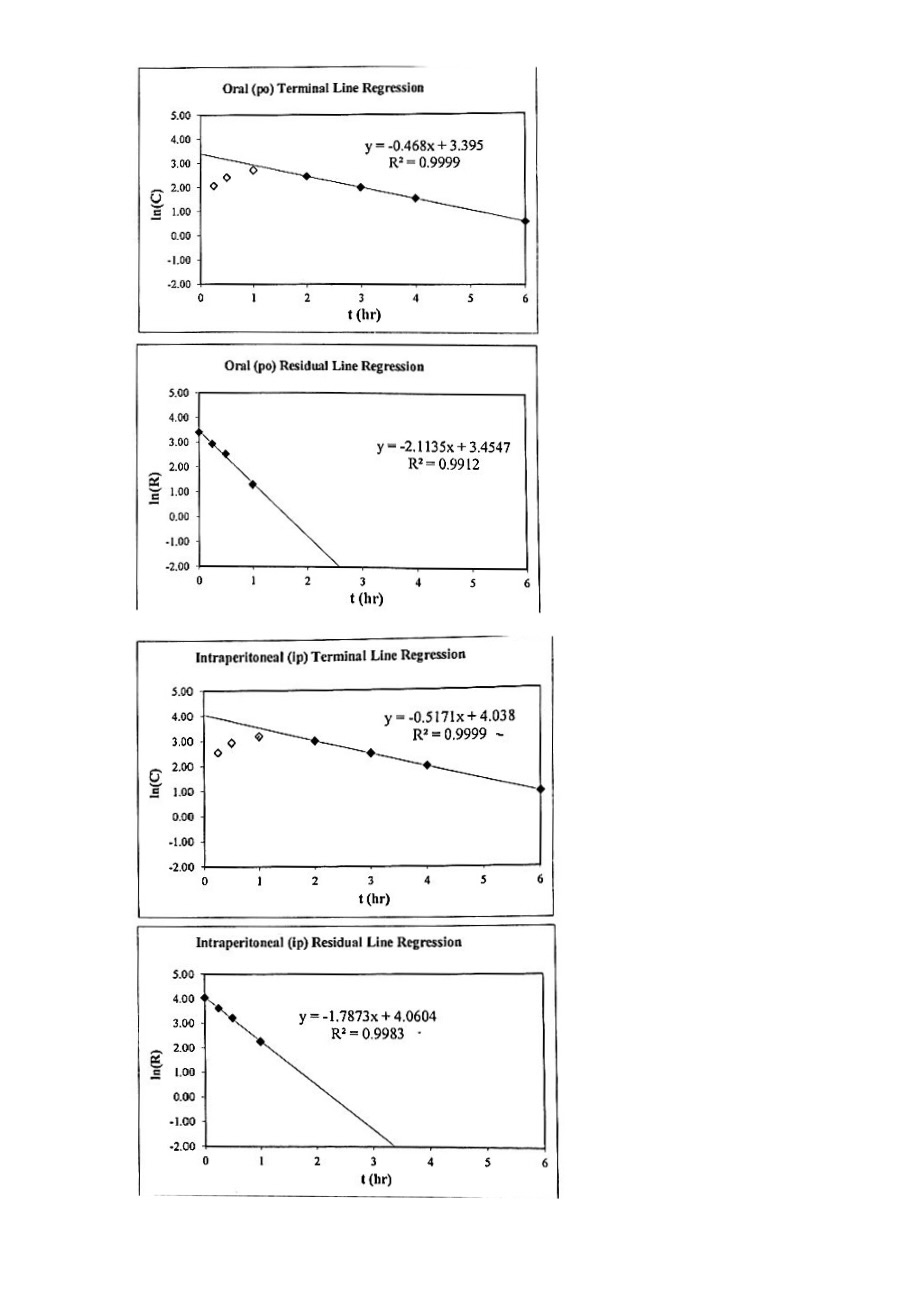
1. In vivo testing provides valuable insight into a drug’s kinetics. Assessing drug kinetics following multiple routes of administration provides greater insight than a single route of administration alone. The following data was collected in 250-g rats following bolus IV, oral (PO), and intraperitoneal (ip) administration.
Using this data and set of graphs, determine:(calculate for each variable)
(a) k, C0, V, and AUC* for the bolus iv data
(b) k, ka, B1, and AUC* for the po data
c) k, ka, B1, and AUC* for the ip data
(d) relative bioavailability for po vs ip, Fpo/Fip
(e)absolute ip bioavailability, Fip
(f) absolute po bioavailability, Fpo

Transcribed Image Text:In(C)
5.00
4.00
3.00
2.00
1.00
0.00
-1.00
-2.00
In(R)
In(C)
Oral (po) Terminal Line Regression
5.00
4.00
3.00
y=-0.468x+3.395
R2 0.9999
D
2.00
1.00
0.00
-1.00
-2.00
0
2
3
4
5
6
t (hr)
Oral (po) Residual Line Regression
y -2.1135x+3.4547
R²=0.9912
3
S
t (hr)
Intraperitoneal (ip) Terminal Line Regression
y -0.5171x+4.038
R2=0.9999-
5.00
4.00
3.00
D
°
2.00
1.00
0.00
-1.00
-2.00
0
2
3
t (hr)
5.00
4.00
3.00
2.00
1.00
0.00
-1.00
In(R)
-2.00
Intraperitoneal (ip) Residual Line Regression
y=-1.7873x+4.0604
R2 0.9983
0
2
3
t (hr)

Transcribed Image Text:1. In vivo testing provides valuable insight into a drug's kinetics. Assessing drug kinetics
following multiple different routes of administration provides greater insight than just a single
route of administration alone. The following data was collected in 250 g rats following bolus
iv, oral (po), and intraperitoneal (ip) administration.
10 mg/kg bolus iv
500 mg/kg po or ip
Time (hr) Civ (mg/L)
Time (hr)
Cpo (mg/L)
Cip (mg/L)
0.083
2.679
0.00
0.00
0.00
0.50
1.988
0.25
7.87
12.73
1.0
1.359
0.50
11.19
18.98
2.0
0.730
1.0
15.07
24.32
3.0
0.401
2.0
11.64
20.02
3.0
7.32
12.02
4.0
4.63
7.27
6.0
1.79
2.53
From this data, the following graphs were created and linear regression lines determined. You
should practice making these graphs, but are not required to make them.
In(C)
Bolus IV Terminal Line Regression
5.00
4.00
3.00
2.00
1.00
y -0.6489x+1.0045
R²=0.9979
0.00
-1.00
-2.00
0
1
2
3
5
6
t (hr)
Expert Solution
This question has been solved!
Explore an expertly crafted, step-by-step solution for a thorough understanding of key concepts.

Step by stepSolved in 2 steps with 9 images

Knowledge Booster

Recommended textbooks for you
- Essentials of Pharmacology for Health ProfessionsNursingISBN:9781305441620Author:WOODROWPublisher:Cengage
Essentials of Pharmacology for Health Professions
Nursing
ISBN:9781305441620
Author:WOODROW
Publisher:Cengage