What is an Enhanced ER model?
The enhanced ER model is an abbreviation for Enhanced Entity-Relationship (EER) model. As you know, the entity-relationship (ER) model is a pictorial illustration of the relationship between various entities of a domain. In the case of a large amount of data with multiple interrelated entities, the ER diagrams become complex and tough to interpret. For such cases, the need for enhancement in the ER model was observed, and thus, the EER model was designed.
The EER model is an enhancement or extension of the ER model. EER was designed to represent complex database problems of engineering, telecommunication, geographic information systems, and complex software systems. EER diagrams are used for modeling data in Database Management System (DBMS).
What are the techniques used in EER model?
The enhanced entity-relationship model uses the concept of subclass and superclass. The techniques of generalization, specialization and aggregation are used in the design of the EER model.
Superclass and Subclass
A superclass is a top-level entity that can be classified into subclasses or subsets. For example, if Vehicle is taken as an entity, then a Truck, Car, and Scooter can be its subclasses. A subclass inherits all the attributes of its superclass. A superclass is also known as a parent class.
Specialization
Specialization is a top-to-bottom approach to designing the Enhanced ER model. In this model, the superclass or the parent entity is defined first using a rectangular box. It can be further categorized into similar entity types. EER diagrams using this data model contain expanded form.
Consider an example of data handling for an automobile company. The company has Vehicle as its prime entity, which is referred to as the superclass. The superclass has attributes such as Color, Type, Engine capacity, etc. The entity Vehicle can be further categorized into subclasses such as Scooter, Car, and Truck. Each subclass inherits all the attributes of the superclass. A subclass can have its own attributes apart from inherited ones.
Take a look at the EER diagram for this company.

SPECIALIZATION: Top to Bottom Approach
In this approach, the EER diagram has relationship D as the junction of the superclass and the subclass. All the subclasses are the subsets of the superclass. If all the subclasses are disjoint, then D is used for the junction, and if they are not disjoint, then O is used.
Generalization
Generalization is extracting the common attributes or properties of the entities to sum up and from a superclass. It is the reverse specialization, which means it uses the bottom-to-top approach. It is a high-level database management system approach that focuses on core values and principles.
For example, consider the entities like Scooter, Car, and Truck. These entities can have attributes such as Number, Engine capacity, Model, Color, etc. Possible superclasses for these entities are Private and Commercial.

GENERALIZATION: Bottom to Top approach
In the diagram, the primary entities are Scooter, Car, and Truck. They act as subclasses for both Private vehicles and Commercial vehicles that can have attributes such as Registration fees, License tenure, Fitness data, etc. The attributes are of the subclasses (Scooter, Car, and Truck), and as they are common attributes, they are taken in the respective superclass. This process of taking out common attributes and reaching the main root is called generalization.
As shown in the EER diagram, the superclass is a subclass for the super-superclass RTO. This process can be extended and bifurcated as per the need for data management.
Both the specialization and generalization approaches of EER diagrams are used to define the product entity type. The entity-relationship model for product-line relationships and attributes is shown using these approaches.
Aggregation
Aggregation is high-level data modeling using both specialization and generalization. The concept of aggregation is generally used to link different entity types with a common relationship. Aggregation is mostly used to show the operational line, execution elements, or functional behavior of the same kind with respect to common attributes.
For example, in an institution, both teachers and students are related to learning, which can be shown as:
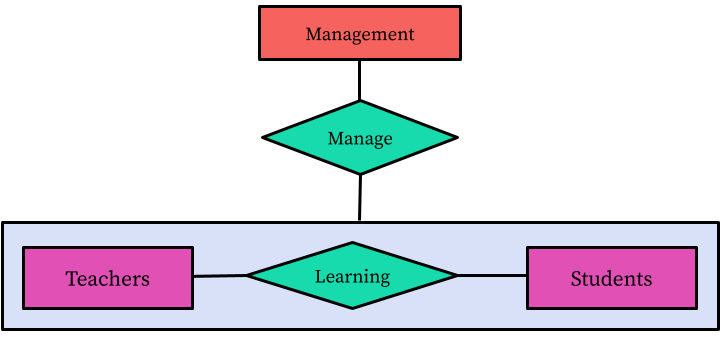
AGGREGATION
Here, aggregation is done for two entities—Teachers and Students—to form a new entity. In this way, aggregation helps to simplify ER diagrams for analysis and other purposes.
EER diagram problem
To check your understanding of EER diagrams, consider the exemplar given below.
Q. A university is offering online courses for graduate and postgraduate programs. It also has special batches for working professionals. Draw an EER diagram to show the possible general entities and attributes to sum up the data for the student database management scheme of the university.
A. For the student database management scheme, you can use the top-to-bottom specialization approach and apply aggregation wherever required.
In simple words, the university has Students and Programs related by enrollment relationship. Students and Programs can be further categorized in terms of specialization to form subclasses.
The following is the possible EER diagram for the given condition.

EER Diagram for a University Database
In the given EER diagram, the entities are taken from a general perspective. They can be provided in the question sometimes. Here, all the sub-sub classes inherit the attributes of their respective superclass and super-superclass. This is a high-level data modeling example of DBMS.
University is the super-superclass for Batches and Specialized programs. It can have attributes like University name, General guidelines, Contact information, and Management entities. All these attributes are inherited down the line. Similarly, Students can have attributes such as Student ID, Name, Contact information, etc. Also, the superclass Programs can have attributes like Name, Code, Duration, and Fees. Student enrolment in programs is shown as a relation. Aggregation is accomplished by combining all entities into a single entity (keeping them all in one rectangular box) that is linked to the university through the Manage (management) relationship.
In the same way, other problems of EER diagrams can be solved.
EER diagrams in MySQL
Let us create an entity-relationship diagram or ERD in MySQL workbench. In the MySQL workbench, this diagram is referred to as an enhanced entity-relationship (EER) diagram. . It is not a static diagram; you can interact with it to make design modifications in a database.
To create EER for a database, connect to a local server; go to the database menu; and select reverse engineer. Reverse engineering can be used to extract data from a database, design and import the data to a new database, or just interact with the EER diagram. When the first dialog box opens, just leave it as localhost. It will probably prompt you for a password. Once it connects, hit Next to get a list of all the available databases. Technically, you can select all databases and generate ERDs for them. To proceed, select the database that does not have too many tables. This ensures that our diagram isn’t too busy. When you hit Next, it is going to do its thing. Click through a few screens here and eventually right in the background you see some graph paper-like graphic, hit Finish. The kind of diagram you will obtain is shown below.

To change the appearance of the diagram, you can click on the tables and move them anywhere on the screen.

Once you’ve finalized the diagram, go to the File menu and hit Save or Export. If required, you can apply various modifications, like editing a table and linking up databases.
Common Mistakes
While drawing EER diagrams in DBMS, take care of the following points to avoid operational mistakes.
- List all the possible or given entities for a data model and do not get confused between entities and attributes.
- Two overlapping sets of entities can have disjoint relations. Hence, focus on the purpose of the data model or derive the maximum number of superclasses.
- For a group of entities related to another entity, use aggregation to refer to the aggregated entity using a tag in the call-by-name procedure.
Context and Applications
This topic is significant for the professional exams of both graduate and postgraduate courses, especially
Bachelors in Computer Application
Bachelors in Computer Science and Information Technology
Bachelors in Computer Science Engineering
Masters in Computer Application
Related Concepts
Sorting
Topological Sort
Database Management System
Data Modelling
Data handling
Practice Problems
Q. 1 The EER model is an abbreviation for:
(A) Effective Entity-Relationship model
(B) Enhanced Entity-Relationship model
(C) Emphasize Entity-Relationship model
(D) Electronic Entity-Relationship model
Correct Option: (B)
Q. 2 Which of the following is not a technique used in the EER model?
(A) Specialization
(B) Generalization
(C) Aggregation
(D) Average
Correct Option: (D)
Q. 3 Which of the following is also known as the parent class?
(A) Subclass
(B) Superclass
(C) Optimum class
(D) Inherit class
Correct Option: (B)
Q. 4 Which of the following statements is not true with respect to EER diagrams?
(A) The attributes of a superclass are inherited by all subclasses.
(B) Generalization, specialization, and aggregation are the techniques used in the EER model.
(C) The EER diagrams are the enhanced approach to make entity-relationship diagrams.
(D) The EER diagram is not a data model.
Correct Option: (D)
Q. 5 In an EER diagram, “D” in a circle represents:
(A) Disjoint
(B) Double
(C) Diagram
(D) None of the above
Correct Option: (A)
Want more help with your computer science homework?
*Response times may vary by subject and question complexity. Median response time is 34 minutes for paid subscribers and may be longer for promotional offers.
Search. Solve. Succeed!
Study smarter access to millions of step-by step textbook solutions, our Q&A library, and AI powered Math Solver. Plus, you get 30 questions to ask an expert each month.
Enhanced ER Model Homework Questions from Fellow Students
Browse our recently answered Enhanced ER Model homework questions.
Search. Solve. Succeed!
Study smarter access to millions of step-by step textbook solutions, our Q&A library, and AI powered Math Solver. Plus, you get 30 questions to ask an expert each month.