What are cash flows?
The cash flows of a firm are of two categories such as cash inflows and cash outflows. Cash inflow is the money or income entering a firm during a specific period whereas cash outflow is the money exiting a firm during a specific period in the form of the expenses incurred by the firm. In other words, we can say that cash flow is a series of expenses and credits that run over the project over the lifetime it existed whereas cash inflows are all the income and gains the company earns as a result of its operations.
Economic engineering analysis
The engineering economy comprises various components such as problem identification, objective definition, cash flow estimation, financial analysis, and decision making. Developing a structured procedure is the best approach to choosing the best answer to the issue. Cash flow is the total money recorded as receipts or disbursements in the financial records of a particular project. A cash flow diagram depicts the flow of cash in the form of arrows on a timeline scaled to the magnitude of the cash flow, where expenses are downward arrows and receipts are upward arrows. The net cash flow may be determined by the difference in the inflow as well as the outflow of the cash flow.
Cash flow diagram
Cash flow diagrams are required to visualize or represent the income and expenses over a certain period. The diagram contains a horizontal line with markers at a series of intervals of time. At particular times, expenses and costs are depicted. Transactions may include initial investments, maintenance costs, projected savings or earnings resulting from the project, as well as the salvage and resale value of the equipment at the termination of the project. These diagrams along with the associated modeling are then used to find out a cash flow neutrality (break-even point) or to analyze operations and profitability
To show an example of the cash flows diagram, consider the cash flows of a simple business project that is undertaken by a firm.
Features of a cash flow diagram
- The horizontal axis of the cash flow diagram represents the time.
- The axis is divided into equal periods.
- The period can be in days, months, or years. It is stretched for the entire duration of the project.
- Cash inflows are represented by the arrows that are pointing in the upward direction.
- Cash outflows are represented by the arrows that are pointing in a downward direction.
- Initial investments are shown at the beginning of the cash flows diagram - at the period 0.
The below table provides information about the project which starts on 1st January with the help of a small initial investment (which is equivalent to $1500). Then the business project receives income in two installments. The first installment is received on 31st March and the second installment is received on 30th June.
| DATE | POSITIVE CASH FLOW AMOUNT | NEGATIVE CASH FLOW AMOUNT |
| 1ST JANUARY | -- | $ 1,000 |
| 31ST MARCH | $ 2,000 | -- |
| 30TH JUNE | $ 2,000 | -- |
The corresponding cash flow diagram that is derived from the table:
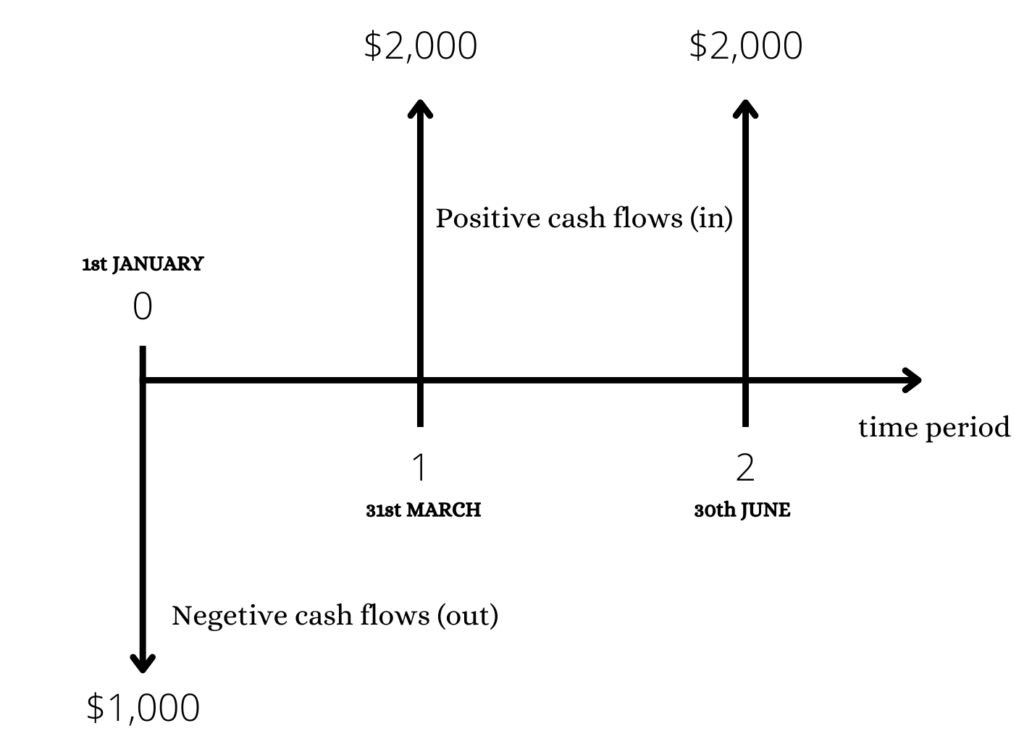
The arrows pointing upwards denote cash inflows. The arrows pointing downwards denote cash outflows.
Interest
In the scenario when the lender provides money to a borrower, the lender expects to receive back the entire borrowed money along with some amount of the interest that will be charged on the money lent. The amount of interest to be paid by the borrower to the lender is evaluated as a percentage of the amount which was borrowed. Interest is the income/receipt from the perspective of the lender and the expense/cost from the perspective of the borrower.
Simple interest
The simple interest (unlike the compound interest) is rare. The simple interest has to be paid at the end of the specific period and it is the fixed amount that has to be paid by the borrower to the lender. It is calculated by the formulae
Simple Interest
Wherein -
- P is the original principal amount
- T is the time (usually it is in years)
- R is the rate of the interest
The total amount has to be calculated using the formulae provided below:
Amount
Example:
A person borrows $2,000 from the Bank of America at a rate of interest of 10% for one year. Calculate the simple interest as well as the amount the person will have to pay at the end of the tenure.
Solution:
Principal amount - $2,000
Rate of the interest - 10 %
Time - 1 year
What is the amount of simple interest and total amount?
Simple Interest
Amount
Compound interest
Compound interest is the most frequently used concept of interest. It is typically imposed on the loans and the deposits. The main difference between the simple interest and the compound interest is that the compound interest depends both on the principal amount as well as the interest that has been accumulated over the periods.
The formula of the total amount is –
Compound interest = Total amount - Principal Amount
In the above formula -
- A = Total amount that will be collected by the lender after the specific period (from the borrower)
- P = Original Principal Amount
- R = rate of the interest (in %)
- N = number of the times the interest is compounded per year
- T = time (usually in years)
Example:
Suppose an individual borrows a $1,200 value loan from a lender at a rate of interest of 10% compounded half-yearly for a tenure of 1.5 years, compute the amount and the compound interest applicable to the individual.
Solution:
P = $ 1,200
R = 10% per annum and the interest is compounded half-yearly.
Therefore N = 2 (since the interest is compounded twice in a year)
T = one and a half years (1.5 years)
Therefore NT
(If the interest is compounded half-yearly, it means that the principal amount will have to change at the end of every 6 months)
A = $1,389.15
Compound interest
The nominal rate of interest and effective rate of interest
If the rate of the interest is 10% per year, and interest is compounded annually. In that case, we could say that the annual nominal rate of interest and the annual effective rate of interest would be equal to each other and both would be equal to 10%.
However, if the number of times the interest rate is compounded per year is more than one, then the effective interest rate will be greater than 10%. The greater the number of times interest compounding happens in a given year, the greater will be the effective interest rate.
The effective interest does take into consideration the compounding period while nominal interest does not.
The formulae for the effective rate of interest is
The effective rate of interest
Here R is the annual nominal rate of interest and N is the number of times the interest is compounded per year.
Example -
If a certain rate of interest is 21% per annum compounded monthly, what will be the effective rate of interest?
Solution:
Thus, the effective rate of interest.
Equivalence
Economic equivalence is used to determine the different amounts of money an individual would get at different points in time, that are equal in economic value. It combines both the interest rate and time value of money concept.
The formula for computing the future value of money is FV = PV (1+i)n
For example, if the rate of interest is 6% per annum, $100 in the present period would be equivalent to $106 one year from the present time.
Future value of the money after 1 year
A similar intuition can be used to calculate equivalent values for the past years.
$100 (in the present period) is equivalent to $94.34 one year before the present period.
(1.06 would be the discount factor)
$94.34 in the previous year, $100 now, and $106 one year from now are equivalent at an annual rate of interest of 6%.
Context and Applications
Interest rates and equivalence are one of the most important topics that have to be studied to understand the economic system of a country.
Interest rates and equivalence are used to understand what would be the cost of the borrowing, how much return one can get on the interest-bearing bank accounts and financial instruments like bonds.
Interest rates and equivalence are taught in schools, undergraduate courses, and postgraduate courses. It is used in mathematics, finance, economics, and accounts.
Practice Problems
1. Which is the most commonly used concept of the interest rate?
- Simple interest
- Compound interest
- The nominal rate of interest
- All of the above
Answer – b
Explanation - The usage of compound interest is very common in the daily lives of individuals. It is used in the financial and banking sectors.
2. On which of the following elements the calculation of the simple interest does not depend?
- Principal amount
- Rate of the interest
- Time
- borrower's bank account
Answer - d
Explanation- Formulae of simple interest . The borrower's bank account has nothing to do with the interest calculation.
3. What would be the value of N in the formula of the compound interest if the interest is compounded quarterly?
- 4
- 2
- 6
- 0.4
Answer – a
Explanation - There are four quarters in a year. The value of N would be 4 because the interest rate is compounded 4 times in a year.
4. What would be the simple interest if, P = $ 500, T = 2, & R = 30%?
- $400
- $300
- $600
- $800
Answer - b
Explanation– Simple interest =
5. In the cash flow diagram, what do the upward and the downward arrows depict respectively?
- Investments and Payback
- Equivalence and Nominal rate
- Borrowing and Lending
- Receipts and Expenses
Answer - d
Explanation – In the cash flow diagram, cash inflows are represented by the arrows that are pointing in the upward direction. Cash outflows are represented by the arrows that are pointing in a downward direction.
Want more help with your economics homework?
*Response times may vary by subject and question complexity. Median response time is 34 minutes for paid subscribers and may be longer for promotional offers.
Cash Flow in Engineering Economics (Interest and Equivalence) Homework Questions from Fellow Students
Browse our recently answered Cash Flow in Engineering Economics (Interest and Equivalence) homework questions.