
Concept explainers
Graph:
To graph: The system of inequalities
Explanation of Solution
Given Information:
The system of inequalities
Graph:
Consider the provided system of inequalities.
To graph the linear inequality
Compute some points on the graph of linear equation
Substitute
So,
Substitute
So,
Substitute
So,
Plot all three points
The graph of the linear equation
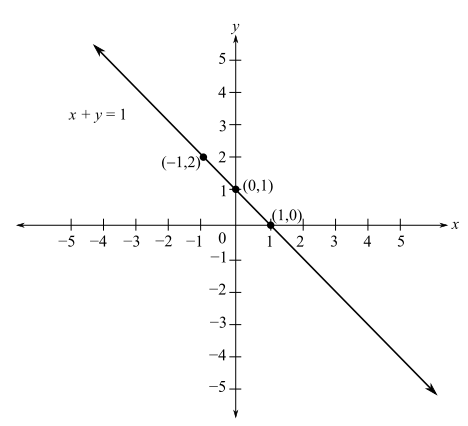
Take
This is false.
So, the region on the opposite side of point
Shade all points on that side of the line using pink shading.
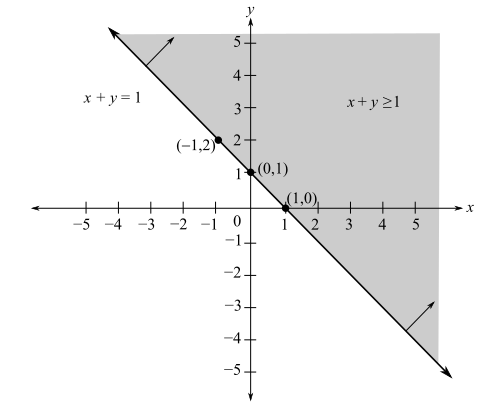
To graph the linear inequality
Compute some points on the graph of linear equation
Substitute
So,
Substitute
So,
Substitute
So,
Plot all three points
The graph of the linear equation
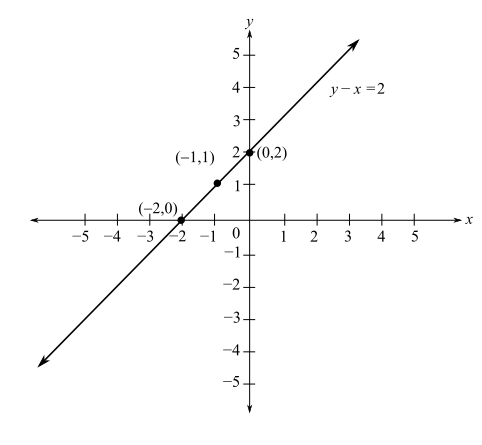
Take
This is false.
So, the region on the opposite side of point
Shade all points on that side of the line using sky blue shading.
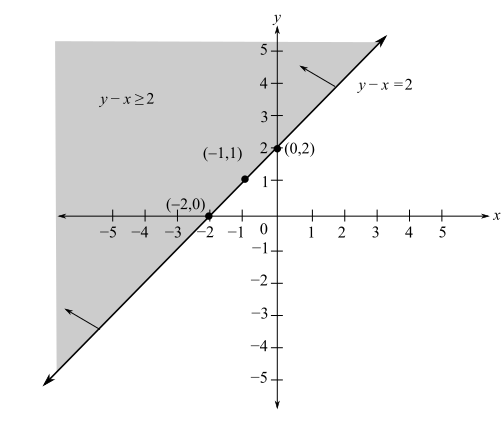
Draw both inequalities on the same graph paper. The intersection of two graphs is as follows
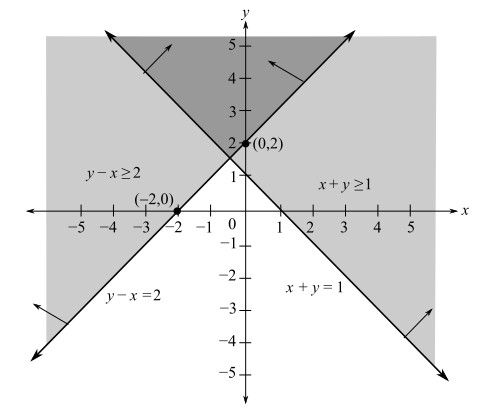
The grey region in the above graph represents the solution of the system of inequalities.
Want to see more full solutions like this?
Chapter M Solutions
Developmental Mathematics (9th Edition)

 Algebra: Structure And Method, Book 1AlgebraISBN:9780395977224Author:Richard G. Brown, Mary P. Dolciani, Robert H. Sorgenfrey, William L. ColePublisher:McDougal Littell
 Holt Mcdougal Larson Pre-algebra: Student Edition...AlgebraISBN:9780547587776Author:HOLT MCDOUGALPublisher:HOLT MCDOUGAL
 Elementary AlgebraAlgebraISBN:9780998625713Author:Lynn Marecek, MaryAnne Anthony-SmithPublisher:OpenStax - Rice University
 Intermediate AlgebraAlgebraISBN:9781285195728Author:Jerome E. Kaufmann, Karen L. SchwittersPublisher:Cengage Learning


