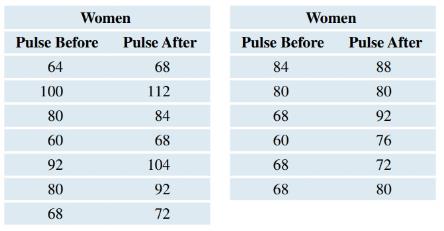
Females’ Pulse Rates before and after a Fright (Example 17) In a statistics class taught by one of the authors, students took their pulses before and after being frightened. The frightening event was having the teacher scream and run from one side of the room to the other. The pulse rates (beats per minute) of the women before and after the scream were obtained separately and are shown in the table. Treat this as though it were a random sample of female community college students. Test the hypothesis that the mean of college women’s pulse rates is higher after a fright, using a significance level of 0.05 . See page 501 for guidance.
Females’ Pulse Rates before and after a Fright (Example 17) In a statistics class taught by one of the authors, students took their pulses before and after being frightened. The frightening event was having the teacher scream and run from one side of the room to the other. The pulse rates (beats per minute) of the women before and after the scream were obtained separately and are shown in the table. Treat this as though it were a random sample of female community college students. Test the hypothesis that the mean of college women’s pulse rates is higher after a fright, using a significance level of 0.05 . See page 501 for guidance.
Females’ Pulse Rates before and after a Fright (Example 17) In a statistics class taught by one of the authors, students took their pulses before and after being frightened. The frightening event was having the teacher scream and run from one side of the room to the other. The pulse rates (beats per minute) of the women before and after the scream were obtained separately and are shown in the table. Treat this as though it were a random sample of female community college students. Test the hypothesis that the mean of college women’s pulse rates is higher after a fright, using a significance level of
0.05
. See page 501 for guidance.
Definition Definition Number of subjects or observations included in a study. A large sample size typically provides more reliable results and better representation of the population. As sample size and width of confidence interval are inversely related, if the sample size is increased, the width of the confidence interval decreases.
Need a deep-dive on the concept behind this application? Look no further. Learn more about this topic, statistics and related others by exploring similar questions and additional content below.
Hypothesis Testing - Solving Problems With Proportions; Author: The Organic Chemistry Tutor;https://www.youtube.com/watch?v=76VruarGn2Q;License: Standard YouTube License, CC-BY
Hypothesis Testing and Confidence Intervals (FRM Part 1 – Book 2 – Chapter 5); Author: Analystprep;https://www.youtube.com/watch?v=vth3yZIUlGQ;License: Standard YouTube License, CC-BY


 Glencoe Algebra 1, Student Edition, 9780079039897...AlgebraISBN:9780079039897Author:CarterPublisher:McGraw Hill
 Holt Mcdougal Larson Pre-algebra: Student Edition...AlgebraISBN:9780547587776Author:HOLT MCDOUGALPublisher:HOLT MCDOUGAL
 Big Ideas Math A Bridge To Success Algebra 1: Stu...AlgebraISBN:9781680331141Author:HOUGHTON MIFFLIN HARCOURTPublisher:Houghton Mifflin Harcourt
 College Algebra (MindTap Course List)AlgebraISBN:9781305652231Author:R. David Gustafson, Jeff HughesPublisher:Cengage Learning