Elementary Statistics Plus MyLab Statistics with Pearson eText -- Title-Specific Access Card Package (13th Edition)
13th Edition
ISBN: 9780134763705
Author: Mario F. Triola
Publisher: PEARSON
expand_more
expand_more
format_list_bulleted
Videos
Textbook Question
Chapter 9, Problem 5RE
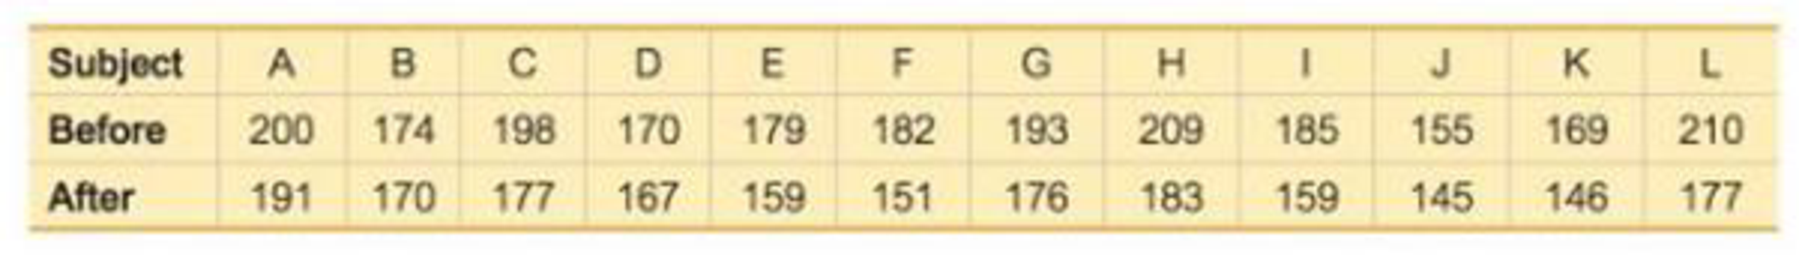
Before /After Treatment Results Captopril is a drug designed to lower systolic blood pressure. When subjects were treated with this drug, their systolic blood pressure readings (in mm Hg) were measured before and after the drug was taken. Results are given in the accompanying table (based on data from “Essential Hypertension: Effect of an Oral Inhibitor of Angiotensin-Converting Enzyme,” by MacGregor et al., British Medical Journal, Vol. 2). Using a 0.01 significance level, is there sufficient evidence to support the claim that captopril is effective in lowering systolic blood pressure?
Expert Solution & Answer
Want to see the full answer?
Check out a sample textbook solution
Students have asked these similar questions
Before/After Treatment Results Captopril is a drug designed to lower systolic blood pressure. When subjects were treated with this drug, their systolic blood pressure readings (in mm Hg) were measured before and after the drug was taken. Results are given in the accompanying table (based on data from “Essential Hypertension: Effect of an Oral Inhibitor of Angiotensin-Converting Enzyme,” by MacGregor et al., British Medical Journal, Vol. 2). Using a 0.01 significance level, is there sufficient evidence to support the claim that Captopril is effective in lowering systolic blood pressure?
Captopril is a drug designed to lower systolic blood pressure. When subjects were treated with this drug, their systolic blood pressure readings (in mm Hg) were measured before and after the drug was taken. Results are given in the accompanying table (based on data from “Essential Hypertension: Effect of an Oral Inhibitor of Angiotensin-Converting Enzyme”, by MacGregor et al., BMJ, Vol. 2). Using a 0.01 significance level, is there sufficient evidence to support the claim that captopril has an effect on systolic blood pressure?
i) Use the Wilcoxon signed-ranks test to conduct the required test without using "wilcox.test" function in R. Please state the hypothesis, provide the p-value, and the conclusion in the context of the problem.
ii) Use the Wilcoxon signed-ranks test to conduct the required test using "wilcox.test" function in R. Please present a screenshot of the R output of your call to the function wilcox.test.
iii) Would you recommend the Wilcoxon signed-ranks test over the…
Captopril is a drug designed to lower systolic blood pressure. When subjects were treated with this drug, their systolic blood pressure readings (in mm Hg) were measured before and after the drug was taken. Results are given in the accompanying table (based on data from "Essential Hypertension: Effect of an Oral Inhibitor of Angiotensin-Converting Enzyme," by MacGregor et al., British Medical Journal, Vol. 2).
Using a 0.01 significance level, is there sufficient evidence to support the claim that captopril has an effect on systolic blood pressure?
Chapter 9 Solutions
Elementary Statistics Plus MyLab Statistics with Pearson eText -- Title-Specific Access Card Package (13th Edition)
Ch. 9.1 - Verifying Requirements In the largest clinical...Ch. 9.1 - Verifying Requirements In the largest clinical...Ch. 9.1 - Hypotheses and Conclusions Refer to the hypothesis...Ch. 9.1 - Using Confidence Intervals a. Assume that we want...Ch. 9.1 - Interpreting Displays. In Exercises 5 and 6, use...Ch. 9.1 - Treating Carpal Tunnel Syndrome Carpal tunnel...Ch. 9.1 - Testing Claims About Proportions. In Exercises...Ch. 9.1 - Accuracy of Fast Food Drive-Through Orders In a...Ch. 9.1 - Testing Claims About Proportions. In Exercises...Ch. 9.1 - Testing Claims About Proportions. In Exercises...
Ch. 9.1 - Testing Claims About Proportions. In Exercises...Ch. 9.1 - Testing Claims About Proportions. In Exercises...Ch. 9.1 - Testing Claims About Proportions. In Exercises...Ch. 9.1 - Testing Claims About Proportions. In Exercises...Ch. 9.1 - Testing Claims About Proportions. In Exercises...Ch. 9.1 - Prob. 16BSCCh. 9.1 - Testing Claims About Proportions. In Exercises...Ch. 9.1 - Testing Claims About Proportions. In Exercises...Ch. 9.1 - Testing Claims About Proportions. In Exercises...Ch. 9.1 - Testing Claims About Proportions. In Exercises...Ch. 9.1 - Testing Claims About Proportions. In Exercises...Ch. 9.1 - Testing Claims About Proportions. In Exercises...Ch. 9.1 - Prob. 23BBCh. 9.1 - Yawning and Fishers Exact Test In one segment of...Ch. 9.1 - Overlap of Confidence Intervals In the article On...Ch. 9.1 - Equivalence of Hypothesis Test and Confidence...Ch. 9.2 - Independent and Dependent Samples Which of the...Ch. 9.2 - Confidence Interval for Hemoglobin Large samples...Ch. 9.2 - Hypothesis Tests and Confidence Intervals for...Ch. 9.2 - Degrees of Freedom For Example 1 on page 431, we...Ch. 9.2 - In Exercises 520, assume that the two samples are...Ch. 9.2 - In Exercises 520, assume that the two samples are...Ch. 9.2 - In Exercises 520, assume that the two samples are...Ch. 9.2 - In Exercises 520, assume that the two samples are...Ch. 9.2 - In Exercises 520, assume that the two samples are...Ch. 9.2 - In Exercises 520, assume that the two samples are...Ch. 9.2 - In Exercises 520, assume that the two samples are...Ch. 9.2 - In Exercises 520, assume that the two samples are...Ch. 9.2 - In Exercises 520, assume that the two samples are...Ch. 9.2 - In Exercises 520, assume that the two samples are...Ch. 9.2 - In Exercises 520, assume that the two samples are...Ch. 9.2 - In Exercises 520, assume that the two samples are...Ch. 9.2 - In Exercises 520, assume that the two samples are...Ch. 9.2 - In Exercises 520, assume that the two samples are...Ch. 9.2 - In Exercises 520, assume that the two samples are...Ch. 9.2 - In Exercises 520, assume that the two samples are...Ch. 9.2 - Larger Data Sets. In Exercises 2124, use the...Ch. 9.2 - Larger Data Sets. In Exercises 2124, use the...Ch. 9.2 - Larger Data Sets. In Exercises 2124, use the...Ch. 9.2 - Larger Data Sets. In Exercises 2124, use the...Ch. 9.2 - Pooling Repeat Exercise 12 IQ and Lead by assuming...Ch. 9.2 - Degrees of Freedom In Exercise 20 Blanking Out on...Ch. 9.2 - No Variation in a Sample An experiment was...Ch. 9.3 - True? For the methods of this section, which of...Ch. 9.3 - Notation Listed below are body temperatures from...Ch. 9.3 - Units of Measure If the values listed in Exercise...Ch. 9.3 - Degrees of Freedom If we use the sample data in...Ch. 9.3 - In Exercises 516, use the listed paired sample...Ch. 9.3 - In Exercises 516, use the listed paired sample...Ch. 9.3 - In Exercises 516, use the listed paired sample...Ch. 9.3 - In Exercises 516, use the listed paired sample...Ch. 9.3 - In Exercises 516, use the listed paired sample...Ch. 9.3 - In Exercises 516, use the listed paired sample...Ch. 9.3 - Prob. 11BSCCh. 9.3 - Prob. 12BSCCh. 9.3 - In Exercises 516, use the listed paired sample...Ch. 9.3 - In Exercises 516, use the listed paired sample...Ch. 9.3 - In Exercises 516, use the listed paired sample...Ch. 9.3 - In Exercises 516, use the listed paired sample...Ch. 9.3 - Prob. 17BSCCh. 9.3 - Larger Data Sets. In Exercises 1724, use the...Ch. 9.3 - Larger Data Sets. In Exercises 1724, use the...Ch. 9.3 - Larger Data Sets. In Exercises 1724, use the...Ch. 9.3 - Larger Data Sets. In Exercises 1724, use the...Ch. 9.3 - Larger Data Sets. In Exercises 1724, use the...Ch. 9.3 - Prob. 23BSCCh. 9.3 - Prob. 24BSCCh. 9.3 - Body Temperatures Refer to Data Set 3 Body...Ch. 9.4 - F Test Statistic a. If s12 represents the larger...Ch. 9.4 - F Test if using the sample data in Data Set 1 Body...Ch. 9.4 - Testing Normality For the hypothesis test...Ch. 9.4 - Prob. 4BSCCh. 9.4 - In Exercises 516, test the given claim. 5. Color...Ch. 9.4 - In Exercises 516, test the given claim. 6. Color...Ch. 9.4 - In Exercises 516, test the given claim. 7. Testing...Ch. 9.4 - In Exercises 516, test the given claim. 8....Ch. 9.4 - In Exercises 516, test the given claim. 9. Coke...Ch. 9.4 - In Exercises 516, test the given claim. 10. IQ and...Ch. 9.4 - Prob. 11BSCCh. 9.4 - Prob. 12BSCCh. 9.4 - Prob. 13BSCCh. 9.4 - Prob. 14BSCCh. 9.4 - In Exercises 516, test the given claim. 15. Old...Ch. 9.4 - In Exercises 516, test the given claim. 16....Ch. 9.4 - Prob. 17BBCh. 9.4 - Prob. 18BBCh. 9.4 - Finding Lower Critical F Values For hypothesis...Ch. 9 - In Exercises 15, use the following survey results:...Ch. 9 - In Exercises 1-5, use the following survey...Ch. 9 - In Exercises 1-5, use the following survey...Ch. 9 - In Exercises 1-5, use the following survey...Ch. 9 - In Exercises 7-5, use the following survey...Ch. 9 - True? Determine whether the following statement is...Ch. 9 - True? When we collect random samples to test the...Ch. 9 - Dependent or Independent? Listed below are...Ch. 9 - Hypotheses Identify the null and alternative...Ch. 9 - Test Statistics Identify the test statistic that...Ch. 9 - Denomination Effect In the article The...Ch. 9 - Denomination Effect Construct the confidence...Ch. 9 - Heights Listed below are heights (cm) randomly...Ch. 9 - Heights Use a 0.01 significance level with the...Ch. 9 - Before /After Treatment Results Captopril is a...Ch. 9 - Eyewitness Accuracy of Police Does stress affect...Ch. 9 - Are Flights Cheaper When Scheduled Earlier? Listed...Ch. 9 - Variation of Heights Use the sample data given in...Ch. 9 - Family Heights. In Exercises 15, use the following...Ch. 9 - Scatterplot Construct a scatterplot of the...Ch. 9 - Family Heights. In Exercises 1-5, use the...Ch. 9 - Family Heights. In Exercises 1-5, use the...Ch. 9 - Assessing Normality Interpret the normal quantile...Ch. 9 - Braking Reaction Times: Histogram Listed below are...Ch. 9 - Braking Reaction Times: Normal? The accompanying...Ch. 9 - Braking Reaction Times: Boxplots Use the same data...Ch. 9 - In Exercises 5-20, assume that the two samples are...Ch. 9 - Braking Reaction Times: Confidence Intervals a....Ch. 9 - FROM DATA TO DECISION Critical Thinking: Did the...Ch. 9 - Critical Thinking: Did the NFL Rule Change Have...Ch. 9 - Critical Thinking: Did the NFL Rule Change Have...
Knowledge Booster


Learn more about
Need a deep-dive on the concept behind this application? Look no further. Learn more about this topic, statistics and related others by exploring similar questions and additional content below.Similar questions
- 4. Captopril is a drug designed to lower systolic blood pressure. When subjects were treated with this drug, their systolic blood pressure readings (in mm Hg) were measured before and after the drug was taken. Results are given in the accompanying table (based on data from “Essential Hypertension: Effect of an Oral Inhibitor of Angiotensin-Converting Enzyme”, by MacGregor et al., BMJ, Vol. 2). Using a 0.01 significance level, is there sufficient evidence to support the claim that captopril has an effect on systolic blood pressure? Explain why statistical methods from Z-interval, Z-test, T-interval or T-test –cannot be used for this problem. Then, use the sign test to conduct the required test in R studio. Please show your work.arrow_forward“Passive and Active Smoke” in Appendix B includes cotinine levels measured in a group of nonsmokers exposed to tobacco smoke (n = 40, Mean = 60.58 ng>mL, s = 138.08 ng>mL) and a group of nonsmokers not exposed to tobacco smoke (n = 40, Mean = 16.35 ng>mL, s = 62.53 ng>mL). Cotinine is a metabolite of nicotine, meaning that when nicotine is absorbed by the body, cotinine is produced. Use a 0.05 significance level to test the claim that nonsmokers exposed to tobacco smoke have a higher mean cotinine level than nonsmokers not exposed to tobacco smoke. Based on your hypothesis tests and confidence intervals, what do you conclude about the effects of second hand smoke? Why?arrow_forward“Passive and Active Smoke” in Appendix B includes cotinine levels measured in a group of nonsmokers exposed to tobacco smoke (n = 40, Mean = 60.58 ng>mL, s = 138.08 ng>mL) and a group of nonsmokers not exposed to tobacco smoke (n = 40, Mean = 16.35 ng>mL, s = 62.53 ng>mL). Cotinine is a metabolite of nicotine, meaning that when nicotine is absorbed by the body, cotinine is produced. Use a 0.05 significance level to test the claim that nonsmokers exposed to tobacco smoke have a higher mean cotinine level than nonsmokers not exposed to tobacco smoke. 1. Construct a confidence interval estimate of the difference betwen the mean continen levels fo the two groups of nonsmokers. What confidence level would be appropriate? 2. Find the margin of error E using the formula. 3. What is the confidence interval? Explain the meaning of the confidence interal and what the limit represents.arrow_forward
- 1. Captopril is a drug designed to lower systolic blood pressure. When subjects were treated with this drug, their systolic blood pressure readings (in mm Hg) were measured before and after the drug was taken. Results are given in the accompanying tables (based on data from "Essential Hypertension: Effect of an Oral Inhibitor of Angiotensin-Converting Enzyme," by MacGregor et al., British Medical Journal, Vol. 2). Using a 0.01 significance level, is there sufficient evidence to support the claim that captopril is effective in lowering systolic blood pressure? Subject Before (x) 200 After (y) А В C D E F G H I K 174 198 170 179 182 193 209 185 155 169 210 191 170 177 167 159 151 176 183 159 145 146 177 2. A study was conducted to investigate the effectiveness for randomly selected subjects are given in the accompanying table (based on "An Analysis of hypnotism in reducing pain. Results Factors That Contribute to the Efficacy of Hypnotic Analgesia," by Price and Barber, Journal of…arrow_forwardDr. Palmer found a small treatment effect. What can she do in improve her changes of finding a statistically significant result?arrow_forwardPlease select the best answer(s). When we see an interaction effect on an ANOVA, this refers to: The DV affects the IV The combined effect of the IVs on the DV The singular effect of one IV on the DV The combined effect of the IV on another IVarrow_forward
- Ost watched Ani... Question 2 Y Part 1 of 4 A doctor in Cleveland wants to know whether the average life span for heart disease patients at four hospitals in the city differ. The data below represents the life span, in years, of heart disease patients from each hospital. Perform an ANOVA test with a 9% level of significance to test whether the average life span of heart disease patients in Cleveland differs depending on the hospital that treats them Life Span of Patients Treated at Hospital 1: 7.4, 7.8, 7.7, 7.5, 8, 8.2, 7.8, 8.6, 8, 7.8, 8.3, 8.3, 8, 7.6, 8.2, 7.9, 7.3, 8, 8.6, 7.3, 8.3, 8, 7.8, 8, 7.8, 8.1, 8.1, 8, 7.6, 7.6, 7.7, 7.4, 7.7, 7.8, 7.8 Life Span of Patients Treated at Hospital 2: 7.9, 7.9, 8.2, 8, 8.1, 8.5, 8.3, 8.4, 8, 8.2, 7.7, 8, 8, 7.8, 7.9, 8.1, 8.1, 7.8, 7.9, 8, 8.5, 8.3, 8.2, 8.3, 7.8, 7.9 Life Span of Patients Treated at Hospital 3: 8.2, 8.1, 7.4, 8.7, 8.6, 8.2, 7.9, 8.1, 8.1, 8.3, 8.3, 8, 7.6, 8, 7.4, 8.6, 8.2, 8.2, 7.9, 7.7, 8.1, 7.9, 8, 8.3 Life Span of…arrow_forwardThe removal of ammoniacal nitrogen is an important aspect of treatment of leachate at landfill sites. The rate of removal (in percent per day) is recorded for several days for each of several treatment methods. The results are presented in the following table. (Based on the article "Removal of Ammoniacal Nitrogen from Landfill Leachate by Irrigation onto Vegetated Treatment Planes," S. Tyrrel, P. Leeds-Harrison, and K. Harrison, Water Research, 2002:291–299.) Treatment Rate of Removal 5.21 4.65 5.59 2.69 7.57 5.16 6.24 5.94 6.41 6.85 9.18 4.94 4.04 3.29 4.52 3.75 Construct an ANOVA table. You may give a range for the P-value. Can you conclude that the treatment methods differ in their rates of removal? a. b. ABCAEarrow_forwardGood Morning, I am needing assistance making the changes the instructor requested be changed on this question. Thank you. Scenario:Is there a relationship between one’s gender and whether one owns a dog, cat, or reptile? Use the data provided in the table below to answer the following questions. Question: Using the degrees of freedom provided by your SPSS output and an alpha value of .05, find the critical value in the appropriate table in the Appendix of your Jackson e-book. Do not round – present all three decimal places. Clearly identify the critical value from your e-book and the obtained value from your SPSS output. Based on this information, would you reject or fail to reject the null hypothesis? Does this mean there is a significant difference or no significant difference? My Answer: The chi-square test of significance between the gender and pets owned is shown. The findings indicate that, with a p-value of 0.177, which is higher than the alpha value, there was no…arrow_forward
- Overproduction of uric acid in the body can be an indication of cell breakdown. This may be an advance indication of illness such as gout, leukemia, or lymphoma. Over a period of months, and adult male patient has taken 13 blood test for uric acid. The main concentration was X=5.41 mg/dl. The distribution of uric acid and healthy adult meals can be assumed to be normal, with o=1.81 mg/dl. find a 95% confidence interval for the population mean concentration of uric acid in the patient's blood. What is the margin of error? (Round your answers to two decimal places.) lower limit= upper limit=arrow_forwardEstriol Level and Birth Weight. J. Greene and J. Touchstone conducted a study on the relationship between the estriol levels of pregnant women and the birth weights of their children. Their findings, “Urinary Tract Estriol: An Index of Placental Function,” were published in the American Journal of Obstetrics and Gynecology (Vol. 85(1), pp. 1–9). The data from the study are provided on the WeissStats site, where estriol levels are in mg/24 hr and birth weights are in hectograms. a. Decide whether finding a regression line for the data is reasonable. If so, then also do parts (b)–(d). b. Obtain the coefficient of determination. c. Determine the percentage of variation in the observed values of the response variable explained by the regression, and interpret your answer. d. State how useful the regression equation appears to be for making predictions.arrow_forwardHoaglin, Mosteller, and Tukey (1983) presented data on blood levels of beta-endorphin as a function of stress. They took beta-endorphin levels for 19 patients 12 hours before surgery and again 10 minutes before surgery. The data are presented below, in fmol/ml Based on these data, what effect does increased stressed have on endorphin levels. include: the hypotheses tested (H0 and H1), the test-statistic and its df, the p-value of the test, and the conclusion as it relates to the research question. Participant 12 hours before 10 minutes before 1 10 6.5 2 6.5 14.0 3 8.0 13.5 4 12 18 5 5.0 14.5 6 11.5…arrow_forward
arrow_back_ios
SEE MORE QUESTIONS
arrow_forward_ios
Recommended textbooks for you
 Glencoe Algebra 1, Student Edition, 9780079039897...AlgebraISBN:9780079039897Author:CarterPublisher:McGraw Hill
Glencoe Algebra 1, Student Edition, 9780079039897...
Algebra
ISBN:9780079039897
Author:Carter
Publisher:McGraw Hill
Hypothesis Testing using Confidence Interval Approach; Author: BUM2413 Applied Statistics UMP;https://www.youtube.com/watch?v=Hq1l3e9pLyY;License: Standard YouTube License, CC-BY
Hypothesis Testing - Difference of Two Means - Student's -Distribution & Normal Distribution; Author: The Organic Chemistry Tutor;https://www.youtube.com/watch?v=UcZwyzwWU7o;License: Standard Youtube License