
MyLab Math with Pearson eText -- Standalone Access Card -- for Precalculus (6th Edition)
6th Edition
ISBN: 9780134757834
Author: Robert F. Blitzer
Publisher: PEARSON
expand_more
expand_more
format_list_bulleted
Videos
Question
Chapter 8.3, Problem 61PE
(a)
To determine
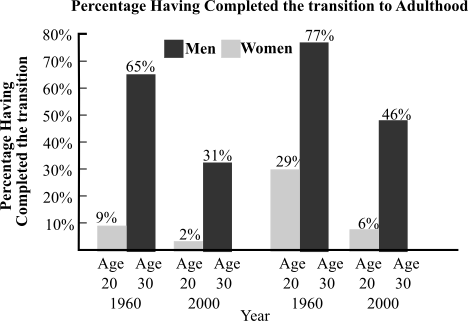
The matrix A that represents the data for the year 2000 that is shown by the graph describing the transition to adulthood. The graph is;
(b)
To determine
The matrix B that represents the data for the year 1960 that is shown by the graph describing the transition to adulthood. The graph is;
(c)
To determine
To calculate: The difference of matrices
Expert Solution & Answer
Want to see the full answer?
Check out a sample textbook solution
Students have asked these similar questions
The data in the table represent the number of licensed drivers in various age groups and the number of fatal accidents within the age group by gender. Complete parts (a) through (c) below.
Click the icon to view the data table.
.....
(c) Was the number of fatal accidents for 16 to 20 year old males above or below average? Was the number of fatal accidents for 21 to 24 year old males above or below average? Was the number of fatal accidents for males greater than 74
years old above or below average? How might an insurance company use this information? Does the same relationship hold for females?
The number of fatal accidents for 16 to 20 year old males was
The number of fatal accidents for 21 to 24 year old males was
The number of fatal accidents for males greater than 74 years old was
An insurance company could use it to argue for higher rates for
drivers and lower rates for
drivers.
Does the same relationship hold for females?
Yes
No
Trying to determine the number of students to accept is a tricky task for universities. The Admissions staff at a small private college
wants to use data from the past few years to predict the number of students enrolling in the university from those who are accepted by
the university. The data are provided in the following table.
R
F
eTextbook and Media
Save for Late
O
%
5
T
O
>>
G H
(9)
2
Number Accepted Number Enrolled
Find the correlation between the number of students accepted and enrolled. Use two decimal places in your answer.
&
2,440
2,800
2,720
2,360
2,660
2,620
8
6
611
K
708
637
584
614
625
(
9
L
Attempts: 0 of 1 used
)
0
P
Submit Answer
56°F Cl
Backspa
The higher education department of Holmes Institute recorded data on the number of students enrolled in the different study majors for the years 2018 and 2019.
Study major
2018
2019
Statistics
1700
2250
Business law
700
900
Accounting
1300
1450
Economics
750
1000
Finance
1450
1758
Marketing management
1069
1189
Auditing
360
351
Use an appropriate graphical technique or chart to compare the number of enrolment in 2018 and 2019 of the different study major. Display the chart.
Use an appropriate graphical technique or chart to display the percentage value of the number of enrolment of the different study major in 2018 and 2019. Display the chart.
Chapter 8 Solutions
MyLab Math with Pearson eText -- Standalone Access Card -- for Precalculus (6th Edition)
Ch. 8.1 - Check Point 1 Write the augmented matrix for the...Ch. 8.1 - Check Point 2 Use the matrix
...Ch. 8.1 - Check Point 3 Use matrices to solve the system:...Ch. 8.1 - Check Point 4 Use matrices to solve the system:...Ch. 8.1 - Check Point 5 Solve the system in Check Point. 3...Ch. 8.1 - Prob. 1CVCCh. 8.1 - Fill in each blank so that the resulting statement...Ch. 8.1 - Prob. 3CVCCh. 8.1 - Prob. 4CVCCh. 8.1 - Fill in each blank so that the resulting statement...
Ch. 8.1 - Fill in each blank so that the resulting statement...Ch. 8.1 - Prob. 1PECh. 8.1 - Prob. 2PECh. 8.1 - Prob. 3PECh. 8.1 - Prob. 4PECh. 8.1 - Prob. 5PECh. 8.1 - Prob. 6PECh. 8.1 - Prob. 7PECh. 8.1 - Prob. 8PECh. 8.1 - Prob. 9PECh. 8.1 - Prob. 10PECh. 8.1 - Prob. 11PECh. 8.1 - Prob. 12PECh. 8.1 - Prob. 13PECh. 8.1 - Prob. 14PECh. 8.1 - Prob. 15PECh. 8.1 - Prob. 16PECh. 8.1 - Prob. 17PECh. 8.1 - Prob. 18PECh. 8.1 - Prob. 19PECh. 8.1 - Prob. 20PECh. 8.1 - Prob. 21PECh. 8.1 - Prob. 22PECh. 8.1 - Prob. 23PECh. 8.1 - Prob. 24PECh. 8.1 - Prob. 25PECh. 8.1 - Prob. 26PECh. 8.1 - Prob. 27PECh. 8.1 - Prob. 28PECh. 8.1 - Prob. 29PECh. 8.1 - Prob. 30PECh. 8.1 - Prob. 31PECh. 8.1 - Prob. 32PECh. 8.1 - Prob. 33PECh. 8.1 - Prob. 34PECh. 8.1 - Prob. 35PECh. 8.1 - In Exercises 21-38, solve each system of equations...Ch. 8.1 - Prob. 37PECh. 8.1 - In Exercises 21-38. solve each system of equations...Ch. 8.1 - Prob. 39PECh. 8.1 - Prob. 40PECh. 8.1 - Prob. 41PECh. 8.1 - Prob. 42PECh. 8.1 - Prob. 43PECh. 8.1 - Prob. 44PECh. 8.1 - Prob. 45PECh. 8.1 - Prob. 46PECh. 8.1 - Prob. 47PECh. 8.1 - Write a system of linear equations in three or...Ch. 8.1 - Prob. 49PECh. 8.1 - Prob. 50PECh. 8.1 - Prob. 51PECh. 8.1 - Prob. 52PECh. 8.1 - Prob. 53PECh. 8.1 - Describe how to use row operations and matrices to...Ch. 8.1 - What is the difference between Gaussian...Ch. 8.1 - Prob. 56PECh. 8.1 - Prob. 57PECh. 8.1 - Prob. 58PECh. 8.1 - Make Sense? In Exercises 59-62, determine whether...Ch. 8.1 - Prob. 60PECh. 8.1 - Prob. 61PECh. 8.1 - Prob. 62PECh. 8.1 - Prob. 63PECh. 8.1 - Prob. 64PECh. 8.1 - Prob. 65PECh. 8.1 - Prob. 66PECh. 8.1 - Prob. 67PECh. 8.1 - Prob. 68PECh. 8.1 - Prob. 69PECh. 8.1 - Prob. 70PECh. 8.1 - Prob. 71PECh. 8.1 - Prob. 72PECh. 8.1 - Prob. 73PECh. 8.1 - Prob. 74PECh. 8.2 - Check Point 1 Use Gaussian elimination to solve...Ch. 8.2 - Check Point 2 Use Gaussian elimination to solve...Ch. 8.2 - Prob. 3CPCh. 8.2 - Check Point 4 Figure 8.5 shows a system of four...Ch. 8.2 - Prob. 1CVCCh. 8.2 - Prob. 2CVCCh. 8.2 - Prob. 3CVCCh. 8.2 - Prob. 4CVCCh. 8.2 - Prob. 5CVCCh. 8.2 - Prob. 1PECh. 8.2 - Prob. 2PECh. 8.2 - Prob. 3PECh. 8.2 - Prob. 4PECh. 8.2 - Prob. 5PECh. 8.2 - Prob. 6PECh. 8.2 - Prob. 7PECh. 8.2 - Prob. 8PECh. 8.2 - Prob. 9PECh. 8.2 - Prob. 10PECh. 8.2 - Prob. 11PECh. 8.2 - In Exercises 1-24, use Gaussian elimination to...Ch. 8.2 - Prob. 13PECh. 8.2 - Prob. 14PECh. 8.2 - Prob. 15PECh. 8.2 - Prob. 16PECh. 8.2 - Prob. 17PECh. 8.2 - Prob. 18PECh. 8.2 - Prob. 19PECh. 8.2 - Prob. 20PECh. 8.2 - Prob. 21PECh. 8.2 - Prob. 22PECh. 8.2 - Prob. 23PECh. 8.2 - Prob. 24PECh. 8.2 - Prob. 25PECh. 8.2 - Prob. 26PECh. 8.2 - Prob. 27PECh. 8.2 - Prob. 28PECh. 8.2 - Prob. 29PECh. 8.2 - Prob. 30PECh. 8.2 - Prob. 31PECh. 8.2 - Prob. 32PECh. 8.2 - 33. The figure shows the intersections of four...Ch. 8.2 - Prob. 34PECh. 8.2 - Prob. 35PECh. 8.2 - Prob. 36PECh. 8.2 - Prob. 37PECh. 8.2 - Describe what happens when Gaussian elimination is...Ch. 8.2 - Prob. 39PECh. 8.2 - Prob. 40PECh. 8.2 - Prob. 41PECh. 8.2 - Prob. 42PECh. 8.2 - Prob. 43PECh. 8.2 - Prob. 44PECh. 8.2 - Prob. 45PECh. 8.2 - Before beginning this exercise, the group needs to...Ch. 8.2 - Prob. 47PECh. 8.2 - Prob. 48PECh. 8.2 - Prob. 49PECh. 8.2 - Prob. 50PECh. 8.2 - Prob. 51PECh. 8.2 - Prob. 52PECh. 8.2 - Prob. 53PECh. 8.3 - Check Point 1 Let
...Ch. 8.3 - Prob. 2CPCh. 8.3 - Prob. 3CPCh. 8.3 - Prob. 4CPCh. 8.3 - Prob. 5CPCh. 8.3 - Prob. 6CPCh. 8.3 - Prob. 7CPCh. 8.3 - Check Point 8 Change the contrast of the letter L...Ch. 8.3 - Prob. 9CPCh. 8.3 - Prob. 1CVCCh. 8.3 - Prob. 2CVCCh. 8.3 - Prob. 3CVCCh. 8.3 - Prob. 4CVCCh. 8.3 - Prob. 5CVCCh. 8.3 - Prob. 6CVCCh. 8.3 - Prob. 7CVCCh. 8.3 - Prob. 8CVCCh. 8.3 - Prob. 9CVCCh. 8.3 - Prob. 10CVCCh. 8.3 - Prob. 1PECh. 8.3 - Prob. 2PECh. 8.3 - Prob. 3PECh. 8.3 - Prob. 4PECh. 8.3 - Prob. 5PECh. 8.3 - Prob. 6PECh. 8.3 - Prob. 7PECh. 8.3 - Prob. 8PECh. 8.3 - Prob. 9PECh. 8.3 - Prob. 10PECh. 8.3 - Prob. 11PECh. 8.3 - Prob. 12PECh. 8.3 - Prob. 13PECh. 8.3 - Prob. 14PECh. 8.3 - Prob. 15PECh. 8.3 - Prob. 16PECh. 8.3 - Prob. 17PECh. 8.3 - Prob. 18PECh. 8.3 - Prob. 19PECh. 8.3 - Prob. 20PECh. 8.3 - Prob. 21PECh. 8.3 - Prob. 22PECh. 8.3 - Prob. 23PECh. 8.3 - Prob. 24PECh. 8.3 - Prob. 25PECh. 8.3 - Prob. 26PECh. 8.3 - Prob. 27PECh. 8.3 - Prob. 28PECh. 8.3 - Prob. 29PECh. 8.3 - Prob. 30PECh. 8.3 - Prob. 31PECh. 8.3 - Prob. 32PECh. 8.3 - Prob. 33PECh. 8.3 - Prob. 34PECh. 8.3 - Prob. 35PECh. 8.3 - Prob. 36PECh. 8.3 - Prob. 37PECh. 8.3 - Prob. 38PECh. 8.3 - Prob. 39PECh. 8.3 - Prob. 40PECh. 8.3 - Prob. 41PECh. 8.3 - Prob. 42PECh. 8.3 - Prob. 43PECh. 8.3 - Prob. 44PECh. 8.3 - Prob. 45PECh. 8.3 - Prob. 46PECh. 8.3 - Prob. 47PECh. 8.3 - Prob. 48PECh. 8.3 - Prob. 49PECh. 8.3 - Prob. 50PECh. 8.3 - Prob. 51PECh. 8.3 - Prob. 52PECh. 8.3 - Prob. 53PECh. 8.3 - Prob. 54PECh. 8.3 - Prob. 55PECh. 8.3 - Prob. 56PECh. 8.3 - Prob. 57PECh. 8.3 - Prob. 58PECh. 8.3 - Prob. 59PECh. 8.3 - Prob. 60PECh. 8.3 - Prob. 61PECh. 8.3 - The table gives an estimate of basic caloric needs...Ch. 8.3 - 63. Tire final grade in a particular course is...Ch. 8.3 - 64. Ina certain county, the proportion of voters...Ch. 8.3 - 65. What is ment by the order or a matrix? Give an...Ch. 8.3 - Prob. 66PECh. 8.3 - Prob. 67PECh. 8.3 - Prob. 68PECh. 8.3 - Prob. 69PECh. 8.3 - Prob. 70PECh. 8.3 - Prob. 71PECh. 8.3 - Prob. 72PECh. 8.3 - Prob. 73PECh. 8.3 - Prob. 74PECh. 8.3 - Prob. 75PECh. 8.3 - Prob. 76PECh. 8.3 - Prob. 77PECh. 8.3 - Prob. 78PECh. 8.3 - Prob. 79PECh. 8.3 - Prob. 80PECh. 8.3 - Prob. 81PECh. 8.3 - Prob. 82PECh. 8.3 - Prob. 83PECh. 8.3 - Prob. 84PECh. 8.3 - Prob. 85PECh. 8.3 - Prob. 86PECh. 8.3 - Prob. 87PECh. 8.3 - Prob. 88PECh. 8.3 - Prob. 89PECh. 8.3 - Prob. 90PECh. 8.3 - Prob. 91PECh. 8.3 - Prob. 1MCCPCh. 8.3 - Prob. 2MCCPCh. 8.3 - Prob. 3MCCPCh. 8.3 - Prob. 4MCCPCh. 8.3 - Prob. 5MCCPCh. 8.3 - Prob. 6MCCPCh. 8.3 - Prob. 7MCCPCh. 8.3 - Prob. 8MCCPCh. 8.3 - Prob. 9MCCPCh. 8.3 - Prob. 10MCCPCh. 8.4 - Check Point 1 Show that B is the multiplicative...Ch. 8.4 - Prob. 2CPCh. 8.4 - Check Point 3 Find the multiplicative inverse of...Ch. 8.4 - Prob. 4CPCh. 8.4 - Prob. 5CPCh. 8.4 - Prob. 6CPCh. 8.4 - Prob. 7CPCh. 8.4 - Prob. 1CVCCh. 8.4 - Prob. 2CVCCh. 8.4 - Prob. 3CVCCh. 8.4 - Prob. 4CVCCh. 8.4 - Prob. 5CVCCh. 8.4 - Prob. 6CVCCh. 8.4 - Prob. 7CVCCh. 8.4 - Prob. 8CVCCh. 8.4 - Prob. 9CVCCh. 8.4 - In Exercises 1-12, find the products AB and BA to...Ch. 8.4 - Prob. 2PECh. 8.4 - Prob. 3PECh. 8.4 - Prob. 4PECh. 8.4 - Prob. 5PECh. 8.4 - Prob. 6PECh. 8.4 - Prob. 7PECh. 8.4 - Prob. 8PECh. 8.4 - Prob. 9PECh. 8.4 - Prob. 10PECh. 8.4 - Prob. 11PECh. 8.4 - Prob. 12PECh. 8.4 - Prob. 13PECh. 8.4 - Prob. 14PECh. 8.4 - Prob. 15PECh. 8.4 - Prob. 16PECh. 8.4 - Prob. 17PECh. 8.4 - Prob. 18PECh. 8.4 - Prob. 19PECh. 8.4 - Prob. 20PECh. 8.4 - Prob. 21PECh. 8.4 - Prob. 22PECh. 8.4 - Prob. 23PECh. 8.4 - Prob. 24PECh. 8.4 - Prob. 25PECh. 8.4 - Prob. 26PECh. 8.4 - Prob. 27PECh. 8.4 - Prob. 28PECh. 8.4 - Prob. 29PECh. 8.4 - Prob. 30PECh. 8.4 - Prob. 31PECh. 8.4 - Prob. 32PECh. 8.4 - Prob. 33PECh. 8.4 - Prob. 34PECh. 8.4 - Prob. 35PECh. 8.4 - Prob. 36PECh. 8.4 - Prob. 37PECh. 8.4 - Prob. 38PECh. 8.4 - Prob. 39PECh. 8.4 - Prob. 40PECh. 8.4 - Prob. 41PECh. 8.4 - Prob. 42PECh. 8.4 - Prob. 43PECh. 8.4 - Prob. 44PECh. 8.4 - Prob. 45PECh. 8.4 - Prob. 46PECh. 8.4 - Prob. 47PECh. 8.4 - Prob. 48PECh. 8.4 - Prob. 49PECh. 8.4 - Prob. 50PECh. 8.4 - In Exercises 51-52, use the coding matrix A=[4131]...Ch. 8.4 - Prob. 52PECh. 8.4 - Prob. 53PECh. 8.4 - Prob. 54PECh. 8.4 - Prob. 55PECh. 8.4 - Prob. 56PECh. 8.4 - Prob. 57PECh. 8.4 - Prob. 58PECh. 8.4 - Prob. 59PECh. 8.4 - Prob. 60PECh. 8.4 - Prob. 61PECh. 8.4 - Prob. 62PECh. 8.4 - Prob. 63PECh. 8.4 - Prob. 64PECh. 8.4 - Prob. 65PECh. 8.4 - Prob. 66PECh. 8.4 - Prob. 67PECh. 8.4 - Prob. 68PECh. 8.4 - Prob. 69PECh. 8.4 - Prob. 70PECh. 8.4 - Prob. 71PECh. 8.4 - In Exercises 71-76, write each system in the form...Ch. 8.4 - Prob. 73PECh. 8.4 - Prob. 74PECh. 8.4 - Prob. 75PECh. 8.4 - Prob. 76PECh. 8.4 - Prob. 77PECh. 8.4 - Prob. 78PECh. 8.4 - Prob. 79PECh. 8.4 - Prob. 80PECh. 8.4 - Prob. 81PECh. 8.4 - I made an encoding error by selecting the wrong...Ch. 8.4 - Prob. 83PECh. 8.4 - Prob. 84PECh. 8.4 - Prob. 85PECh. 8.4 - Prob. 86PECh. 8.4 - Prob. 87PECh. 8.4 - Prob. 88PECh. 8.4 - 89. Give an example of a matrix that is its own...Ch. 8.4 - Prob. 90PECh. 8.4 - Prob. 91PECh. 8.4 - Prob. 92PECh. 8.4 - Prob. 93PECh. 8.4 - Prob. 94PECh. 8.4 - Prob. 95PECh. 8.4 - Prob. 96PECh. 8.4 - Prob. 97PECh. 8.4 - Prob. 98PECh. 8.4 - Prob. 99PECh. 8.5 - Prob. 1CPCh. 8.5 - Prob. 2CPCh. 8.5 - Prob. 3CPCh. 8.5 - Prob. 4CPCh. 8.5 - Prob. 5CPCh. 8.5 - Prob. 6CPCh. 8.5 - Prob. 1CVCCh. 8.5 - Prob. 2CVCCh. 8.5 - Prob. 3CVCCh. 8.5 - Prob. 4CVCCh. 8.5 - Prob. 5CVCCh. 8.5 - Prob. 1PECh. 8.5 - Prob. 2PECh. 8.5 - Prob. 3PECh. 8.5 - Prob. 4PECh. 8.5 - Prob. 5PECh. 8.5 - Prob. 6PECh. 8.5 - Prob. 7PECh. 8.5 - Prob. 8PECh. 8.5 - Prob. 9PECh. 8.5 - Prob. 10PECh. 8.5 - Prob. 11PECh. 8.5 - Prob. 12PECh. 8.5 - Prob. 13PECh. 8.5 - Prob. 14PECh. 8.5 - Prob. 15PECh. 8.5 - Prob. 16PECh. 8.5 - Prob. 17PECh. 8.5 - Prob. 18PECh. 8.5 - Prob. 19PECh. 8.5 - Prob. 20PECh. 8.5 - Prob. 21PECh. 8.5 - Prob. 22PECh. 8.5 - Prob. 23PECh. 8.5 - Prob. 24PECh. 8.5 - Prob. 25PECh. 8.5 - Prob. 26PECh. 8.5 - Prob. 27PECh. 8.5 - Prob. 28PECh. 8.5 - Prob. 29PECh. 8.5 - Prob. 30PECh. 8.5 - Prob. 31PECh. 8.5 - Prob. 32PECh. 8.5 - In Exercises 29-36, use Cramer's Rule to solve...Ch. 8.5 - Prob. 34PECh. 8.5 - Prob. 35PECh. 8.5 - Prob. 36PECh. 8.5 - Prob. 37PECh. 8.5 - Prob. 38PECh. 8.5 - Prob. 39PECh. 8.5 - Prob. 40PECh. 8.5 - Prob. 41PECh. 8.5 - Prob. 42PECh. 8.5 - Prob. 43PECh. 8.5 - Prob. 44PECh. 8.5 - Prob. 45PECh. 8.5 - Prob. 46PECh. 8.5 - Prob. 47PECh. 8.5 - Prob. 48PECh. 8.5 - Prob. 49PECh. 8.5 - Prob. 50PECh. 8.5 - Prob. 51PECh. 8.5 - then the points ,and are collinear. If the...Ch. 8.5 - Prob. 53PECh. 8.5 - Prob. 54PECh. 8.5 - Prob. 55PECh. 8.5 - Prob. 56PECh. 8.5 - Prob. 57PECh. 8.5 - Prob. 58PECh. 8.5 - Prob. 59PECh. 8.5 - Prob. 60PECh. 8.5 - Prob. 61PECh. 8.5 - 62. If you could use only one method to solve...Ch. 8.5 - Use the feature of your graphing utility that...Ch. 8.5 - Prob. 64PECh. 8.5 - Prob. 65PECh. 8.5 - Prob. 66PECh. 8.5 - Prob. 67PECh. 8.5 - Prob. 68PECh. 8.5 - Prob. 69PECh. 8.5 - Prob. 70PECh. 8.5 - Prob. 71PECh. 8.5 - Prob. 72PECh. 8.5 - Prob. 73PECh. 8.5 - Prob. 74PECh. 8.5 - 75. Show that the equation of a line through and ...Ch. 8.5 - Prob. 76PECh. 8.5 - Prob. 77PECh. 8.5 - Prob. 78PECh. 8.5 - Prob. 79PECh. 8.5 - Prob. 80PECh. 8.5 - Prob. 81PECh. 8.5 - Prob. 82PECh. 8.5 - Prob. 83PECh. 8 - Prob. 1RECh. 8 - Prob. 2RECh. 8 - Prob. 3RECh. 8 - Prob. 4RECh. 8 - Prob. 5RECh. 8 - Prob. 6RECh. 8 - Prob. 7RECh. 8 - Prob. 8RECh. 8 - Prob. 9RECh. 8 - Prob. 10RECh. 8 - Prob. 11RECh. 8 - Prob. 12RECh. 8 - Prob. 13RECh. 8 - Prob. 14RECh. 8 - Prob. 15RECh. 8 - Prob. 16RECh. 8 - Prob. 17RECh. 8 - Prob. 18RECh. 8 - Prob. 19RECh. 8 - Prob. 20RECh. 8 - Prob. 21RECh. 8 - Prob. 22RECh. 8 - Prob. 23RECh. 8 - Prob. 24RECh. 8 - Prob. 25RECh. 8 - Prob. 26RECh. 8 - Prob. 27RECh. 8 - Prob. 28RECh. 8 - Prob. 29RECh. 8 - Prob. 30RECh. 8 - Prob. 31RECh. 8 - Prob. 32RECh. 8 - Prob. 33RECh. 8 - Prob. 34RECh. 8 - Prob. 35RECh. 8 - Prob. 36RECh. 8 - Prob. 37RECh. 8 - Prob. 38RECh. 8 - Prob. 39RECh. 8 - Prob. 40RECh. 8 - Prob. 41RECh. 8 - Prob. 42RECh. 8 - Prob. 43RECh. 8 - Prob. 44RECh. 8 - Prob. 45RECh. 8 - Prob. 46RECh. 8 - Prob. 47RECh. 8 - Prob. 48RECh. 8 - Prob. 49RECh. 8 - Prob. 50RECh. 8 - Prob. 51RECh. 8 - Prob. 52RECh. 8 - Prob. 53RECh. 8 - Prob. 54RECh. 8 - Prob. 55RECh. 8 - Prob. 56RECh. 8 - Prob. 1TCh. 8 - Prob. 2TCh. 8 - Prob. 3TCh. 8 - Prob. 4TCh. 8 - Prob. 5TCh. 8 - Prob. 6TCh. 8 - Prob. 7TCh. 8 - Prob. 8TCh. 8 - Prob. 9TCh. 8 - Prob. 10TCh. 8 - Prob. 1CRECh. 8 - Prob. 2CRECh. 8 - Prob. 3CRECh. 8 - Prob. 4CRECh. 8 - Solve each equation or inequality in Exercises...Ch. 8 - Prob. 6CRECh. 8 - Prob. 7CRECh. 8 - Prob. 8CRECh. 8 - Prob. 9CRECh. 8 - Prob. 10CRECh. 8 - Prob. 11CRECh. 8 - Prob. 12CRECh. 8 - Prob. 13CRECh. 8 - Prob. 14CRECh. 8 - Prob. 15CRECh. 8 - Prob. 16CRECh. 8 - Prob. 17CRECh. 8 - Prob. 18CRECh. 8 - Prob. 19CRECh. 8 - Prob. 20CRECh. 8 - Prob. 21CRECh. 8 - Prob. 22CRECh. 8 - Prob. 23CRECh. 8 - Prob. 24CRECh. 8 - Prob. 25CRE
Knowledge Booster


Learn more about
Need a deep-dive on the concept behind this application? Look no further. Learn more about this topic, calculus and related others by exploring similar questions and additional content below.Similar questions
- A real estate major collected information on some recent local home sales. The first 6 lines of the database appear in the accompanying table. The columns correspond to the house identification number, the community name, the zip code, the number of acres of the property, the year the house was built, the market value, and the size of the living area (in square feet). Do the data appear to have come from a designed survey or experiment? What concerns might you have about drawing conclusions from this data set? E Click the icon to view the data table. Do the data appear to have come from a designed survey or experiment? O A. It is not clear if the data were obtained from an experiment. They are certainly not from a survey. O B. It is not clear if the data were obtained from a survey. They are certainly not from an experiment. O C. It is not clear if the data were obtained from a survey or an experiment. O D. The data were certainly not obtained from survey or an experiment. What…arrow_forwardIdentify the mode of the set of data: 87,90,86,95,2,87,88,94,86,97 ?a. 90b. 87c. 86d. 85arrow_forwardQ4B The World Bank collected data on the percentage of GDP that a country spends on health expenditures ("Health expenditure," 2013) and also the percentage of women receiving prenatal care ("Pregnant woman receiving," 2013). The data for the 15 countries where this information are available for the year 2011 is in the table below: Health Expenditure (% of GDP) Prenatal Care (%) 9.6 47.9 3.7 54.6 5.2 93.7 5.2 84.7 10.0 100.0 4.7 42.5 4.8 96.4 6.0 77.1 5.4 58.3 4.8 95.4 4.1 78.0 6.0 93.3 9.5 93.3 6.8 93.7 6.1 89.8 4. Use the correlation coefficient r to find the coefficient of determination r2 Enter answer to nearest ten-thousandth. Examples of correctly entered responses: 0.9566 0.4070 0.5590 5. What percentage of the variability in the percentage of women receiving prenatal care is accounted for by the percentage of GDP spent on healthcare? A.…arrow_forward
- Paint lifetime: A paint company collected data on the lifetime (in years) of its paint in eleven United States cities. The data are in the following table. Average annual Precipitation (inches) 48.6 43.8 29.3 26.4 City Atlanta, GA Boston, MA Kansas City, KS Minneapolis, MN Dallas, TX Denver, CO Miami, FL Phoenix, AZ San Francisco, CA Seattle, WA Send data to Excel Paint Lifetime Part 1 of 2 11.5 11.7 12.3 10.5 11.2 15.2 8.7 11.1 16.7 Average January Temperature 41.9 29.6 28.4 11.2 45.0 29.5 67.1 52.3 48.5 40.6 Average July Temperature 78.6 73.5 80.9 73.1 86,3 73.3 82.4 92.3 62.2 65.3 34.2 15.3 57.5 7.1 19.7 38.9 In Cheyenne, Wyoming, the average January temperature is 26.1, the average July temperature is 68.9, and the average annual precipitation is 13.3. Construct a 95% confidence interval for the paint lifetime. Round your answers to at least two decimal places.arrow_forwardThe police lieutenant in charge of the traffic division has reviewed the number of traffic citations issued per day by each of the 10 police officers in his division. The data were: 13, 21, 12, 34, 31, 13, 22, 26, 25, and 23. What is the mode of the number of citations issued per day? a. 22,5 b. 13,5 c. 22 d. 13arrow_forwardA city official would like to know if there is public support for increasing funding for arts programs. To collect data, the city official stands outside a concert hall after a show and surveys every 25th person to exit and asks their opinion about raising funds for the arts. Which of the following describes the population in this scenario? all residents of the city the members of the city council all city residents who support the arts the people surveyed by the city officialarrow_forward
- PLEASE ANSWER NUMBER 2, A-E. THANKS!arrow_forwardCreate scatterplot using Excel with the following variables: gender: 0 = male, 1 = female. height: in inches. weight: in pounds. First we will create a scatterplot to examine how weight is related to height, ignoring gender. To do that in Excel: Sort the data by gender: Hold down the Control key (Command key on MacOS) and click the A key to select all of the data in the worksheet. Select the Home tab, then the Editing group Sort & Filter -> Custom Sort. In the pop-up window, make sure that My list has headers box is checked and then choose gender from the pull-down menu next to Sort by. Click OK. Now select all of the data in columns B and C, select the Insert tab and in the Charts group choose Scatter. Choose the first scatterplot option (Scatter with only Markers). Now we have a scatterplot, but the data is all on the right of the plot. To fix this: Right-click on the x-axis, and choose Format Axis from the pop-up menu. Make sure that Axis Options is selected on the left, and…arrow_forwardPark City, Utah was settled as a mining community in 1870 and experienced growth until the late 1950s when the price of silver dropped. In the past 40 years, Park City has experienced new growth as a thriving ski resort. The population data for selected years between 1900 and 2009 are given below. Park City, Utah Year 1900 1930 1940 1950 1970 1980 1990 2000 2009 Population 3759 4281 3739 2254 1193 2823 4468 7341 11983 (a) What behavior of a scatter plot of the data indicates that a cubic model is appropriate? O a change in concavity and neither a relative maximum nor a relative minimum O a change in concavity and both a relative maximum and a relative minimum O no change in concavity and an absolute minimum O no change in concavity and an absolute maximum (b) Align the input so that t = 0 in 1900. Find a cubic model for the data. (Round all numerical values to three decimal places.) p(t) = (c) Numerically estimate the derivative of the model in 2007 to the nearest hundred. p'(107) =…arrow_forward
- Find the mode of this set of data: 24, 27, 32, 29, 31, 35, 27, 32, 23, 25, 30, 24, 30, 35, 40arrow_forwardOffice-chair racing is now an official sport in Japan. Teams of 3 race around a 200-meter circuit for 2 hours to see who can complete the most laps. Tonya, an office-chair racing coach, contacts the top 5 teams and randomly assigns them to complete a practice race using one of two popular brands of office chair: Brand A and Brand B. In a different time period, the same teams complete a practice race using the opposite brand of chair. Here are the data: A 2-column table with 5 rows. Column 1 is labeled Brand A with entries 116, 107, 101, 97, 94. Column 2 is labeled Brand B with entries 114, 102, 100, 94, 90. Calculate the mean difference (Brand A – Brand B) and the standard deviation of the differences.arrow_forwardThe data give the average number of days in May that are clear and cloudy in two cities. Clear Cloudy Total Sacramento, CA 17 13 30 San Antonio, TX 24 30 Total 23 37 60 6,arrow_forward
arrow_back_ios
SEE MORE QUESTIONS
arrow_forward_ios
Recommended textbooks for you
 Glencoe Algebra 1, Student Edition, 9780079039897...AlgebraISBN:9780079039897Author:CarterPublisher:McGraw Hill
Glencoe Algebra 1, Student Edition, 9780079039897...
Algebra
ISBN:9780079039897
Author:Carter
Publisher:McGraw Hill
Finite Math: Markov Chain Example - The Gambler's Ruin; Author: Brandon Foltz;https://www.youtube.com/watch?v=afIhgiHVnj0;License: Standard YouTube License, CC-BY
Introduction: MARKOV PROCESS And MARKOV CHAINS // Short Lecture // Linear Algebra; Author: AfterMath;https://www.youtube.com/watch?v=qK-PUTuUSpw;License: Standard Youtube License
Stochastic process and Markov Chain Model | Transition Probability Matrix (TPM); Author: Dr. Harish Garg;https://www.youtube.com/watch?v=sb4jo4P4ZLI;License: Standard YouTube License, CC-BY