Videos
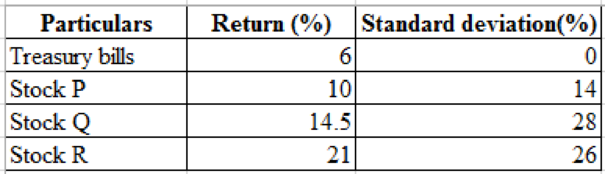
Portfolio risk and return* Here are returns and standard deviations for four investments.
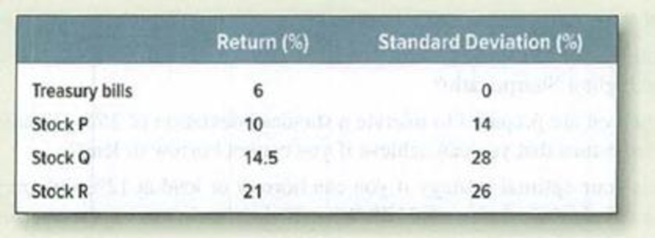
Calculate the standard deviations of (the following portfolios.
- a. 50% in Treasury bills, 50% in stock P.
- b. 50% each in Q and R, assuming the shares have
- • Perfect positive correlation.
- • Perfect negative correlation.
- • No correlation.
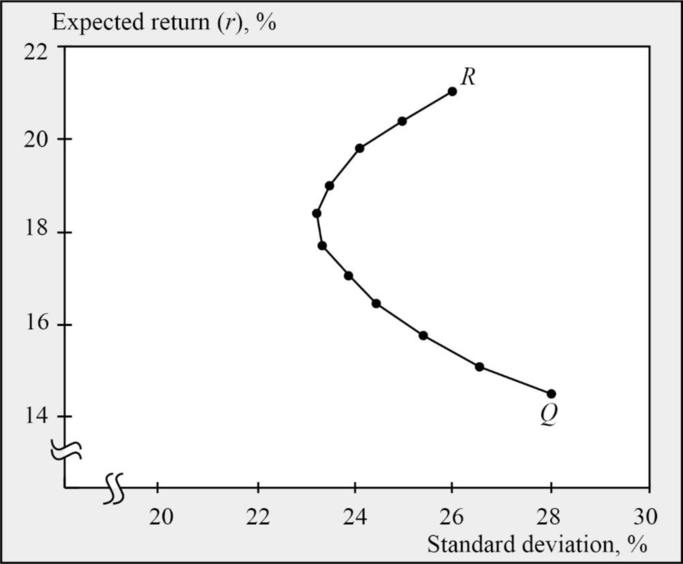
- c. Plot a figure like Figure 8.3 for Q and R, assuming a correlation coefficient of .5.
- d. Stock Q has a lower return than R but a higher standard deviation. Does that mean that Q’s price is too high or that R’s price is too low?
a)
To determine: Standard deviation of 50% Treasury bills and 50% in stock P.
Explanation of Solution
Given information:
Calculation of standard deviation:
Therefore, the standard deviation is 7%
b)
To determine: Standard deviation of 50% each in Q and R in the following situations.
Explanation of Solution
With a perfect positive correlation:
Therefore, the standard deviation in a perfect positive correlation is 27%
With a perfect negative correlation:
Therefore, the standard deviation in a perfect positive correlation is 1%
With no correlation:
Therefore, the standard deviation in a perfect positive correlation is 19.1%
c)
To graph: Figure showing the stocks of Q and R by assuming a correlation coefficient of 0.5
Explanation of Solution
d)
To discuss: If Q has a low return than R but with a higher standard deviation whether this mean that price of Q’s stock is too high or price of R’s stock is too low.
Explanation of Solution
When stock Q has lower return that stock R but, higher standard deviation, thus this doesn’t mean that price of Q’s stock is too high or price of R’s stock is too low. Because the risk factor is measured by beta not by the standard deviation.
Standard deviation measures the total risk whereas, beta measures non-diversifiable risk and inventors are solely compensated with a risk premium in holding the non-diversifiable risk.
Want to see more full solutions like this?
Chapter 8 Solutions
Principles of Corporate Finance (Mcgraw-hill/Irwin Series in Finance, Insurance, and Real Estate)


- An investiment portfolio consists of two securities, X and Y. The weight of X is 30%. Asset X's expected return is 15% and the standard deviation is 28%. Asset Y's expected return is 23% and the standard deviation is 33%. Assume the correlation coefficient between X and Y is 0.37. A. Calcualte the expected return of the portfolio. B. Calculate the standard deviation of the portfolio return. C. Suppose now the investor decides to add some risk free assets into this portfolio. The new weights of X, Y and risk free assets are 0.21, 0.49 and 0.30. What is the standard deviation of the new portfolio?arrow_forward4. Suppose that we have three stocks with the following parameter values. Expected Standard Correlations of Returns Return Deviation Stock 1 Stock 2 Stock 3 Stock 1 0.20 0.25 1.00 0.30 0.40 Stock 2 0.25 0.35 1.00 0.60 Stock 3 0.15 0.15 1.00 (a) Find the expected return and standard deviation of a portfolio with 25% in stock 1, 50% in stock 2, and 25% in stock 3. Show your steps. (b) For the portfolio in part (a), find the covariance of its return with the return of the equally weighted portfolio of stock 1 and stock 2. (Equal weighting for a two-asset portfolio means that the weights are 50% and 50%.) Show your steps. (c) Someone claims that the portfolio in part (a) is the tangency portfolio of these three stocks. (Note that the concept of the tangency portfolio was explained in Class 5.) Do you believe this claim? Justify your answer. Hint: It may be useful to compare the portfolio in part (a) to a portfolio with somewhat different weights.arrow_forwardConsider a portfolio consisting of the following three stocks: an expected return of 8%. The risk-free rate is 3%. a. Compute the beta and expected return of each stock. ▪ The volatility of the market portfolio is 10% and it has b. Using your answer from part a, calculate the expected return of the portfolio. c. What is the beta of the portfolio? d. Using your answer from part c, calculate the expected return of the portfolio and verify that it matches your answer to part b.arrow_forward
- From the following information, calculate covariance between stocks A and B and expected return and risk of a portfolio in which A and B are equally weighted.Which stock would be recommend if investment in individual stock is to be made? Justify answer using numerical calculations. Stock A Stock B Expected return 24% 35% Standard deviation 12% 18% Coefficient of correlation 0.65 0.65arrow_forwardExpected return of a portfolio using beta. The beta of four stocks—P, Q, R, and S—are 0.49, 0.81, 1.19, and 1.53, respectively and the beta of portfolio 1 is 1.01, the beta of portfolio 2 is 0.86, and the beta of portfolio 3 is 1.15. What are the expected returns of each of the four individual assets and the three portfolios if the current SML is plotted with an intercept of 4.5% (risk-free rate) and a market premium of 12.0% (slope of the line)? What is the expected return of stock P? (Round to two decimal places.) What is the expected return of stock Q? (Round to two decimal places.) What is the expected return of stock R? (Round to two decimal places.) What is the expected return of stock S? (Round to two decimal places.) What is the expected return of portfolio 1? (Round to two decimal places.) What is the expected return of portfolio 2? (Round to two decimal places.) What is the expected return of portfolio 3?…arrow_forwardExpected return of a portfolio using beta. The beta of four stocks—G, H, I, and J—are 0.44, 0.75, 1.21, and 1.55, respectively and the beta of portfolio 1 is 0.99, the beta of portfolio 2 is 0.83, and the beta of portfolio 3 is 1.14. What are the expected returns of each of the four individual assets and the three portfolios if the current SML is plotted with an intercept of 3.5% (risk-free rate) and a market premium of 10.0% (slope of the line) What is the expected return of portfolio 1? (Round to two decimal places.) What is the expected return of portfolio 2? (Round to two decimal places.) What is the expected return of portfolio 3? (Round to two decimal places.)arrow_forward
- Expected return of a portfolio using beta. The beta of four stocks—G, H, I, and J—are 0.44, 0.75, 1.21, and 1.55, respectively and the beta of portfolio 1 is 0.99, the beta of portfolio 2 is 0.83, and the beta of portfolio 3 is 1.14. What are the expected returns of each of the four individual assets and the three portfolios if the current SML is plotted with an intercept of 3.5% (risk-free rate) and a market premium of 10.0% (slope of the line)? What is the expected return of stock G? (Round to two decimal places.) What is the expected return of stock H? (Round to two decimal places.) What is the expected return of stock I? (Round to two decimal places.) What is the expected return of stock J? (Round to two decimal places.) What is the expected return of portfolio 1? (Round to two decimal places.) What is the expected return of portfolio 2? (Round to two decimal places.) What is the expected return of portfolio 3?…arrow_forwardCalculate the standard deviation of a portfolio with 0.24 invested in Asset A, 0.33 invested in Asset B, and the rest invested in Asset C. Express your answer as a decimal with four digits after the decimal point (e.g., 0.1234, not 12,34%). Std Dev(A) = 0.43, Std Devirg) = 0.67. Std Dev(rc)=0.53 Correlation(A) =-0.24, Correlation(Arc)-0.32, Correlationirere)=0.09 Type your answer.....arrow_forwardThe securities of firms A and B have the expected return and standard deviations given below. The expected correlation between the two stocks is 0.1 (see the attached picture) Calculate the return and risk for each of the following portfolios: 100% A 100% B 60% A - 40% B 50% A - 50% Barrow_forward
- Consider an investment portfolio that consists of three different stocks, with the amount invested in each asset shownbelow. Assume the risk-free rate is 2.5% and the market risk premium is 6%. Use this information to answer thefollowing questions.Stock Weights BetasChesapeake Energy 25% 0.8Sodastream 50% 1.3Pentair 25% 1.0a) Compute the expected return for each stock using the CAPM and assuming that the stocks are all fairly priced.b) Compute the portfolio beta and the expected return on the portfolio.c) Now assume that the portfolio only includes 50% invested in Pentair and 50% invested in Sodastream (i.e., a twoassetportfolio). The yearly-return standard deviation of Pentair is 48% and the yearly-return standard deviation ofSodastream is 60%. The correlation coefficent between Pentair’s returns and Sodastream’s returns is 0.3 What is theexpected yearly-return standard deviation for this portfolio?arrow_forwardConsider a portfolio consisting of the following three stocks: E The volatility of the market portfolio is 10% and it has an expected return of 8%. The risk-free rate is 3%. a. Compute the beta and expected return of each stock. b. Using your answer from part (a), calculate the expected return of the portfolio. c. What is the beta of the portfolio? d. Using your answer from part (c), calculate the expected return of the portfolio and verify that it matches your answer to part (b). a. Compute the beta and expected return of each stock. (Round to two decimal places.) TITLT Data table Portfolio Weight (A) Volatility (B) Correlation (C) Expected Return (E) % Beta (D) НЕС Согр 0.28 13% 0.33 Green Widget (Click on the following icon a in order to copy its contents into a spreadsheet.) 0.39 27% 0.61 % Portfolio Weight Alive And Well 0.33 14% 0.43 Volatility 13% Correlation with the Market Portfolio НЕС Согр Green Widget 0.28 0.33 b. Using your answer from part (a), calculate the expected…arrow_forwardFrom the following information, calculate covariance between stocks A and B and expected return and risk of a portfolio in which A and B are equally weighted.Which stock would be best recommend if investment in individual stock is to be made? Justify the answer using numerical calculations. Stock A Stock B Expected return 24% 35% Standard deviation 12% 18% Coefficient of correlation 0.65arrow_forward
 EBK CONTEMPORARY FINANCIAL MANAGEMENTFinanceISBN:9781337514835Author:MOYERPublisher:CENGAGE LEARNING - CONSIGNMENT