
Videos
The authors of the paper “Development of Nutritionally At-Risk Young Children is Predicted by Malaria, Anemia, and Stunting in Pemba, Zanzibar” (The Journal of Nutrition [2009]:763–772) studied factors that might be related to dietary deficiencies in children. Children were observed for a length of time and the time spent in various activities was recorded. One variable of interest was the length of time (in minutes) a child spent fussing.
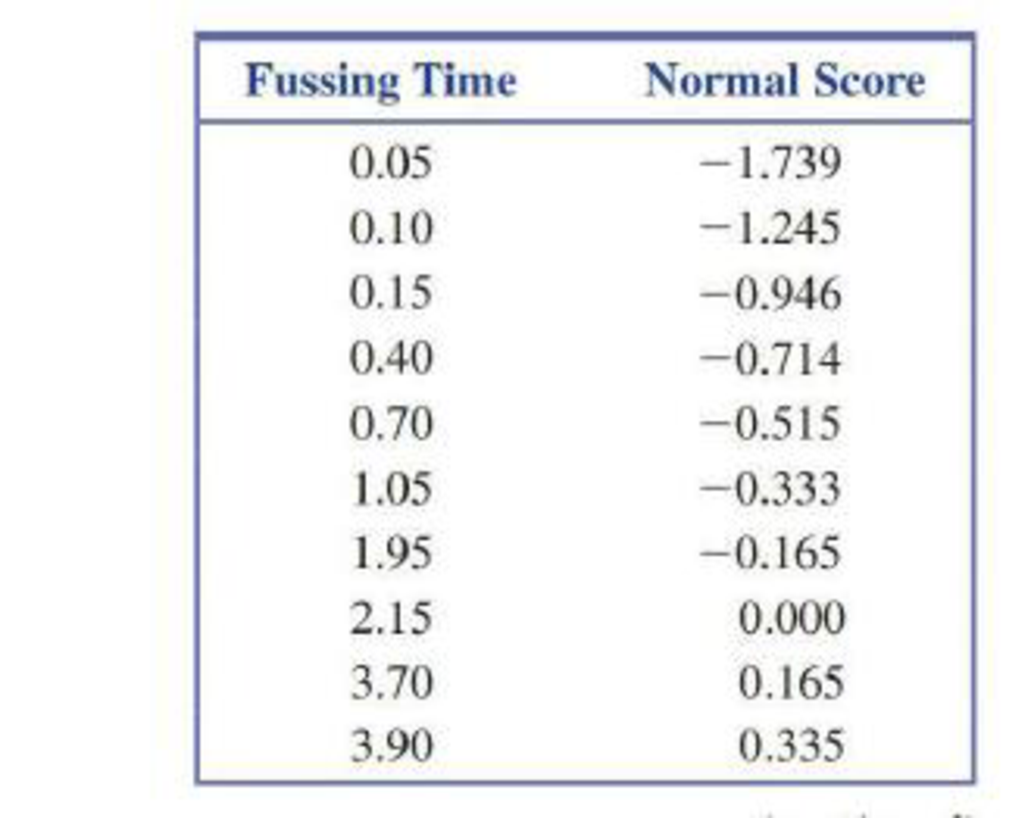
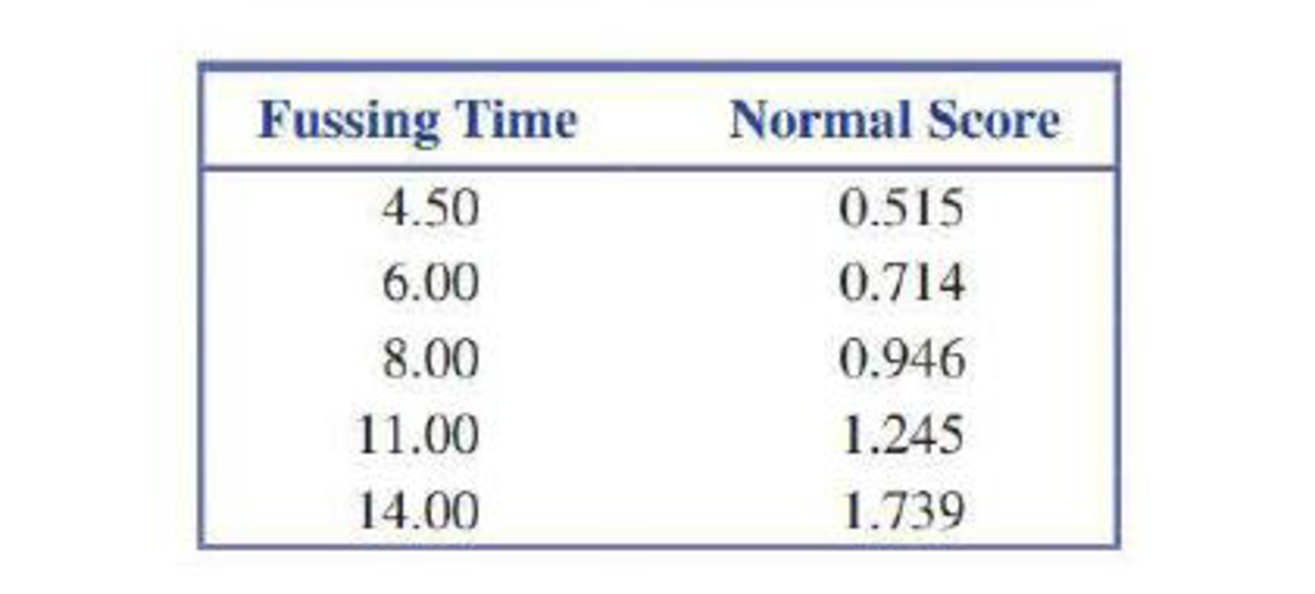
The authors comment that the distribution of fussing times was skewed and that they used a square root transformation to create a distribution that was more approximately normal. Data consistent with summary quantities in the paper for 15 children are given in the accompanying table.
Normal scores for a samples size of 15 are also given.
- a. Construct a normal
probability plot for the fussing time data. (Hint: See Example 7.31.) - b. Does the plot from Part (a) look linear? Do you agree with the authors of the paper that the fussing time distribution is not normal?
- c. Transform the data by taking the square root of each data value. Construct a normal probability plot for the square root transformed data.
- d. How do the normal probability plots from Parts (a) and (c) compare?
Want to see the full answer?
Check out a sample textbook solution
Chapter 7 Solutions
Introduction to Statistics and Data Analysis


 Linear Algebra: A Modern IntroductionAlgebraISBN:9781285463247Author:David PoolePublisher:Cengage Learning
 Holt Mcdougal Larson Pre-algebra: Student Edition...AlgebraISBN:9780547587776Author:HOLT MCDOUGALPublisher:HOLT MCDOUGAL
 Calculus For The Life SciencesCalculusISBN:9780321964038Author:GREENWELL, Raymond N., RITCHEY, Nathan P., Lial, Margaret L.Publisher:Pearson Addison Wesley,
 Big Ideas Math A Bridge To Success Algebra 1: Stu...AlgebraISBN:9781680331141Author:HOUGHTON MIFFLIN HARCOURTPublisher:Houghton Mifflin Harcourt
 Glencoe Algebra 1, Student Edition, 9780079039897...AlgebraISBN:9780079039897Author:CarterPublisher:McGraw Hill