
Concept explainers
Videos
On average, every minute of every day, 158 babies are born. The bar graph represents the results of a single day of births, deaths, and population increase worldwide. Exercises 25-26 are based on the information displayed by the graph.
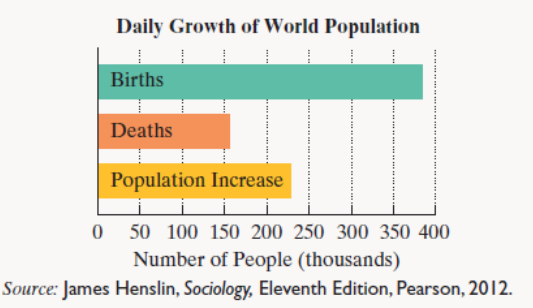
Each day, the number of births in the world is 84 thousand less than three times the number of deaths.
a. If the population increase in a single day is 228 thousand, determine the number of birth and deaths per day.
b. If the population increase in a single day is 228 thousand, by how many millions of people does the worldwide population increase each year? Round to the nearest million.
c. Based on your answer to part (b), approximately how many years does it take for the population of the world to increase by an amount greater than the entire U.S. population (315 million)?
Want to see the full answer?
Check out a sample textbook solution
Chapter 6 Solutions
THINKING MATHEMATICALLY W/ACCESS
Additional Math Textbook Solutions
Calculus Volume 2
Calculus for Business, Economics, Life Sciences, and Social Sciences (13th Edition)
Pathways To Math Literacy (looseleaf)
Basic College Mathematics
A Survey of Mathematics with Applications (10th Edition) - Standalone book


- Please help with (d)arrow_forwardA corporation that operates five suppliers of athletic apparel in a region provides merchandise for a shoe company. The shoe company recently sought information from the five plants. One variable for which data were collected was the total money (in dollars) the company spent on medical support for its employees in the first three months of the year. Data on number of employees at the plants are also shown below. Complete parts a and b. Medical Employees $7,788 121 $14,371 409 $12,776 256 $6,874 107 $3,907 O 68 a. Compute the weighted mean medical payments for these five plants using the numbers of employees as the weights. The weighted mean is $. (Round to the nearest dollar as needed.)arrow_forwardA statistics professor kept attendance records and recorded the number of absent students per class. This data is displayed in the following histogram with the frequency of each number of absent students shown above the bars. How many total classes do these data represent?arrow_forward
- Jester's Deli sells 640 sandwiches at a price of $8 each. A market survey shows that for every $0.10 reduction in price, 40 more sandwiches will be sold. Let x represent the number of $0.10 reductions.arrow_forwardIn a survey, respondents were asked which type of movie they watched most often. The bar graph shows how many males and how many females said they watched each type of movie most often. How many more females said they watched science fiction movies than detective movies?arrow_forwardThere are 22 women and 6 men. If a bar graph were drawn to represent this data, and the length of the bar for women was 5 inches long, then how long should the bar for men be? Round to the nearest tenth of an inch.arrow_forward
- a flute instructor examined student progressarrow_forwardplease answer 8d, e, and f.arrow_forwardExpress all answers as decimals rounded to 3 decimal places, if needed. Express percentages as decimals (instead of 25.6%, use .256) Cell phone users in Boise can choose between three carriers: Sprint, AT&T, and Verizon. Advertising by all three companies results in a continual shift of customers. Each year, Sprint loses 30% of customers to AT&T and 30% to Verizon. AT&T loses 20% to Sprint and 10% to Verizon. Verizon loses 25% to Sprint and 25% to AT&T. Currently, Sprint has 25% of the market, AT&T has 35%, and Verizon has 40%. Use the order Sprint (S), AT&T (A), Verizon (V) throughout this assignment. 1. State the probability vector: 2. Create the transition matrix, labeling rows and columns, and draw the transition diagram. Create your matrix with the rows ordered S, A, and V, and columns ordered S, A, and V. 3. Assume that for 5 years this trend continues. State the transition matrix after 5 years. 4. What is the market share for each company after 5 years? Sprint: AT&T: Verizon: 5.…arrow_forward
- Part 3: Create a visual of your model- Use what you found in parts 1 and 2. Use smiley face stickers for the 30 people and the 100 gold star stickers for the wealth. Asia North America Europe North America South America Europe Africa Oceania Antarctica South America Africa Oceania 57 52arrow_forwardA box office analyst seeks to predict opening weekend box office gross for movies. Toward this goal, the analyst plans to use online trailer views as a predictor. For each of the 66 movies, the number of online trailer views from the release of the trailer through the Saturday before a movie opens and the opening weekend box office gross (in millions of dollars) are collected and stored in the accompanying table. Complete the parts below.arrow_forwardIn the graph shown below, what is the total number of programs in the three Study Areas that have the least number of programs? Input just the number.arrow_forward
 Algebra & Trigonometry with Analytic GeometryAlgebraISBN:9781133382119Author:SwokowskiPublisher:Cengage
 Glencoe Algebra 1, Student Edition, 9780079039897...AlgebraISBN:9780079039897Author:CarterPublisher:McGraw Hill
 Holt Mcdougal Larson Pre-algebra: Student Edition...AlgebraISBN:9780547587776Author:HOLT MCDOUGALPublisher:HOLT MCDOUGAL
 Algebra: Structure And Method, Book 1AlgebraISBN:9780395977224Author:Richard G. Brown, Mary P. Dolciani, Robert H. Sorgenfrey, William L. ColePublisher:McDougal Littell
 College Algebra (MindTap Course List)AlgebraISBN:9781305652231Author:R. David Gustafson, Jeff HughesPublisher:Cengage Learning
 Big Ideas Math A Bridge To Success Algebra 1: Stu...AlgebraISBN:9781680331141Author:HOUGHTON MIFFLIN HARCOURTPublisher:Houghton Mifflin Harcourt