
Concept explainers
Videos
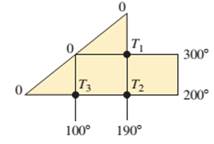
Heat transfer. In a study of heat transfer in a grid of wires, the at an exterior node is maintained at a constant value (in °F) as shown in the accompanying figure. When the grid is in thermal equilibrium, the temperature at an interior node is the average of the temperatures at the four adjacent nodes. For instance.
Want to see the full answer?
Check out a sample textbook solution
Chapter 6 Solutions
College Algebra, Books a la Carte Edition Plus NEW MyLab Math with Pearson eText - Access Card Package (3rd Edition)


- The population P (in millions) of Texas from 2001 through 2014 can be approximated by the model P=20.913e0.0184t, where t represents the year, with t=1 corresponding to 2001. According to this model, when will the population reach 32 million?arrow_forwardPharmacology The percent p of prescriptions filled with generic drugs at CVS Pharmacies from 2008 through 2014 (see figure) can be approximated by the model pt=2.77t+45.2,8t111.95t+55.9,12t14 where t represents the year, with t=8 corresponding to 2008. Use this model to find the percent of prescriptions filled with generic drugs in each year from 2008 through 2014.arrow_forwardThe number N of visitors to a new website is given in the table t weeks after the website was launched. 2 3 24 50 121 270 640 a. Use a graphing utility to find an equation of the form N = abt to model the data. Round a to 1 decimal place and b to 3 decimal places. b. Use a graphing utility to graph the data and the model from part (a). c. Use the model to predict the number of visitors to the website 10 weeks after launch. Round to the nearest thousand.arrow_forward
- The electric power consumed each month by a chemical plant is thought to be related to the average ambient temperature (x₁), the number of days in the month (x₂), the average product purity (x3), and the tons of product produced (x4). The past year's historical data are available and are presented in the following table: Y 240 236 270 274 301 316 270 296 267 276 288 261 25 31 45 60 65 72 80 84 75 60 50 38 X2 24 21 24 25 25 26 25 25 24 25 25 23 Fit a multiple linear regression to predict power (y) using x1, X2 X3, and X4. Calculate R2 for this model. Round your answer to 3 decimal places. 91 90 88 87 91 94 87 86 88 91 90 89 X4 100 95 110 88 94 99 97 96 110 105 100 98arrow_forwardPlz asaparrow_forwardIn this example we use the typical sales price of homes in a random sample of US counties (recorded with units as $1000 per square foot) to predict the typical rental cost in the county (in units of $ per square foot). y: The typical Rental Cost in the county (units: $ per square foot). x: The typical sales price of properties in the county (units: $1000 per square foot). Assume we compare counties A and B. County A has a typical sales price of properties at $258 per square foot higher than county B. Assume the regression equation is ŷ = 0.5 +2.2x. This model would predict the Rental cost in county A to be. $ per square foot higher than the rental cost in county B. Record your answer with at least 3 decimal places. You should really carefully consider the units for this problem. 567.6 A calculation to report a predicted change in y for a given change in x should not require using the intercept as part of the calculation. Based on the interpretation of the slope an additional $1000…arrow_forward
- Please help me answer g and h with complete solutionarrow_forwardHelp with 7arrow_forwardSuppose you are interested in explaining maximum July temperatures in degrees Fahrenheit and latitude in degrees north of the equator. You check weather data and observe the following data for Edmonton, Calgary, Denver, and El Paso respectively; Latitude (X) = [51, 53, 39, 31] and Temperature (Y) = [89, 91, 90, 109]. Which city is the closest to its predicted value? Edmonton Calgary Two cities are equally close to their predicted valuesarrow_forward
- Part A: You are calibrating a temperature sensor that you believe will have a linear input/output relationship. You collect the three data points below: Temperature (C) 0 50 100 Output Voltage (V) 1.2 1.9 3.2 You wish to find output Voltage as a function of input Temperature (i.e., the calibration curve), and assume a linear relationship of the form: V = a₁T + ao Using the method and equations we discussed in class, find the coefficients a, and a for the best fit regression line.arrow_forwardFind one slope in this examplearrow_forwardMarine scientists use a linear model for the speed c of sound in the oceans as a function of the salinity S at a fixed depth and temperature.† In the following table, one scientist recorded data for c and S at a depth of 500 meters and a temperature of 15 degrees Celsius. Here c is measured in meters per second and S in parts per thousand. Salinity S Sound speed c 35.0 1515.36 35.6 1516.08 36.2 1516.80 36.8 1517.62 37.4 1518.24 (a) Looking over the table, the scientist realizes that one of the entries for sound speed is in error. Which entry is it?S = What is the correct speed?c = m/sec(b) Explain in practical terms the meaning of the slope of the linear model for c in terms of S at the given depth and temperature. The slope means that, at the given depth and temperature, for an increase in salinity of part per thousand the speed of sound increases by meters per second. (c) Calculate c(38.2).c(38.2) = m/secExplain in practical terms what it means. This means…arrow_forward

 Algebra & Trigonometry with Analytic GeometryAlgebraISBN:9781133382119Author:SwokowskiPublisher:Cengage
 Algebra: Structure And Method, Book 1AlgebraISBN:9780395977224Author:Richard G. Brown, Mary P. Dolciani, Robert H. Sorgenfrey, William L. ColePublisher:McDougal Littell
 Elementary Linear Algebra (MindTap Course List)AlgebraISBN:9781305658004Author:Ron LarsonPublisher:Cengage Learning
 Glencoe Algebra 1, Student Edition, 9780079039897...AlgebraISBN:9780079039897Author:CarterPublisher:McGraw Hill