
Concept explainers
Videos
The possible outcomes of an experiment involving the roll of a six-sided die are a one-spot, a two-spot, a three-spot, a four-spot, a five-spot, and a six-spot
- (a) Develop a
probability distribution for the number of possible spots. - (b) Portray the probability distribution graphically.
- (c) What is the sum of the probabilities?
a.
Give a probability distribution for the number of possible spots.
Answer to Problem 1SR
The probability distribution for the number of possible spots is as follows:
| Number of spots | Probability |
| 1 | 0.16667 |
| 2 | 0.16667 |
| 3 | 0.16667 |
| 4 | 0.16667 |
| 5 | 0.16667 |
| 6 | 0.16667 |
| Total | 1 |
Explanation of Solution
The outcomes of the experiment are one-spot, two-spot, three-spot, four-spot, five-spot, and six-pot. Thus, there are 6 possible outcomes. The experiment involves the roll of six-sided die. Hence, each outcome has probability of one-sixth.
The probability distribution for the number of possible spots is as follows:
| Number of spots | Probability |
| 1 | |
| 2 | |
| 3 | |
| 4 | |
| 5 | |
| 6 | |
| Total | 1 |
Thus, the probability distribution for the number of possible spots is obtained.
b.
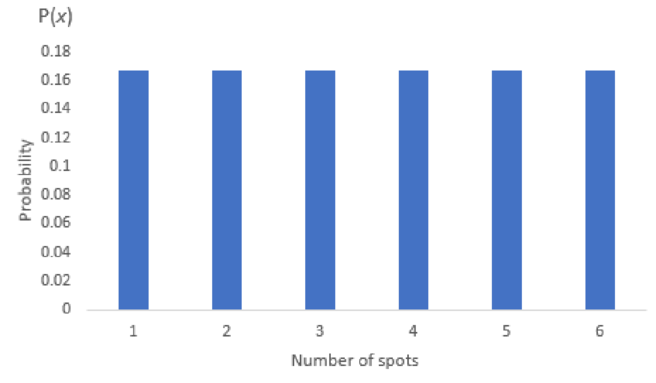
Show the probability distribution graphically.
Answer to Problem 1SR
The graph of the probability distribution is as follows:
Explanation of Solution
Step-by-step procedure to plot probability distribution graph using EXCEL:
- Enter the probability values in a column.
- Select the data and go to Insert.
- In Charts, select 2-D Column.
Thus, the probability distribution graph is obtained.
c.
Calculate the sum of the probabilities.
Answer to Problem 1SR
The sum of probabilities is 1.
Explanation of Solution
The sum of probabilities is calculated as follows:
Therefore, the sum of probabilities is 1.
Want to see more full solutions like this?
Chapter 6 Solutions
Statistical Techniques in Business and Economics


- Flexible Work Hours In a recent survey, people were asked whether they would prefer to work flexible hours----even when it meant slower career advancement----so they could spend more time with their families. The figure shows the results of the survey. What is the probability that three people chosen at random would prefer flexible work hours?arrow_forwardA manufacturer has determined that a machine averages one faulty unit for every 500 it produces. What is the probability that an order of 300 units will have one or more faulty units?arrow_forwardIn Example 8, what is the probability that an employee chosen at random has 30 or more years of service?arrow_forward

 College AlgebraAlgebraISBN:9781305115545Author:James Stewart, Lothar Redlin, Saleem WatsonPublisher:Cengage Learning
 Holt Mcdougal Larson Pre-algebra: Student Edition...AlgebraISBN:9780547587776Author:HOLT MCDOUGALPublisher:HOLT MCDOUGAL