MATLAB: An Introduction with Applications
6th Edition
ISBN: 9781119256830
Author: Amos Gilat
Publisher: John Wiley & Sons Inc
expand_more
expand_more
format_list_bulleted
Question
D, E and F please, thank you!

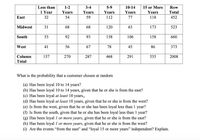
Transcribed Image Text:**Survey: Customer Loyalty**
Are customers more loyal in the east or in the west? The following table is based on information from Trends in the United States. The columns represent the length of customer loyalty (in years) at a primary supermarket. The rows represent regions in the United States.
Note: The table itself is not included in the image.

Transcribed Image Text:**Table Overview**
The table presents customer loyalty data segmented by geographical region—East, Midwest, South, and West—and by loyalty duration categories: Less than 1 Year, 1-2 Years, 3-4 Years, 5-9 Years, 10-14 Years, and 15 or More Years. The Row Totals and Column Totals are also included, providing comprehensive insights into customer distribution across regions and loyalty durations.
**Data Breakdown**
- **East:**
- Less than 1 Year: 32
- 1-2 Years: 54
- 3-4 Years: 59
- 5-9 Years: 112
- 10-14 Years: 77
- 15 or More Years: 118
- Row Total: 452
- **Midwest:**
- Less than 1 Year: 31
- 1-2 Years: 68
- 3-4 Years: 68
- 5-9 Years: 120
- 10-14 Years: 63
- 15 or More Years: 173
- Row Total: 523
- **South:**
- Less than 1 Year: 53
- 1-2 Years: 92
- 3-4 Years: 93
- 5-9 Years: 158
- 10-14 Years: 106
- 15 or More Years: 158
- Row Total: 660
- **West:**
- Less than 1 Year: 41
- 1-2 Years: 56
- 3-4 Years: 67
- 5-9 Years: 78
- 10-14 Years: 45
- 15 or More Years: 86
- Row Total: 373
- **Column Totals:**
- Less than 1 Year: 157
- 1-2 Years: 270
- 3-4 Years: 287
- 5-9 Years: 468
- 10-14 Years: 291
- 15 or More Years: 535
- Total Customers: 2008
**Probability Questions**
(a) What
Expert Solution
This question has been solved!
Explore an expertly crafted, step-by-step solution for a thorough understanding of key concepts.
This is a popular solution
Trending nowThis is a popular solution!
Step by stepSolved in 4 steps with 4 images

Knowledge Booster
Similar questions
Recommended textbooks for you
 MATLAB: An Introduction with ApplicationsStatisticsISBN:9781119256830Author:Amos GilatPublisher:John Wiley & Sons Inc
 Probability and Statistics for Engineering and th...StatisticsISBN:9781305251809Author:Jay L. DevorePublisher:Cengage Learning
 Statistics for The Behavioral Sciences (MindTap C...StatisticsISBN:9781305504912Author:Frederick J Gravetter, Larry B. WallnauPublisher:Cengage Learning
 Elementary Statistics: Picturing the World (7th E...StatisticsISBN:9780134683416Author:Ron Larson, Betsy FarberPublisher:PEARSON
 The Basic Practice of StatisticsStatisticsISBN:9781319042578Author:David S. Moore, William I. Notz, Michael A. FlignerPublisher:W. H. Freeman
 Introduction to the Practice of StatisticsStatisticsISBN:9781319013387Author:David S. Moore, George P. McCabe, Bruce A. CraigPublisher:W. H. Freeman

MATLAB: An Introduction with Applications
Statistics
ISBN:9781119256830
Author:Amos Gilat
Publisher:John Wiley & Sons Inc

Probability and Statistics for Engineering and th...
Statistics
ISBN:9781305251809
Author:Jay L. Devore
Publisher:Cengage Learning

Statistics for The Behavioral Sciences (MindTap C...
Statistics
ISBN:9781305504912
Author:Frederick J Gravetter, Larry B. Wallnau
Publisher:Cengage Learning

Elementary Statistics: Picturing the World (7th E...
Statistics
ISBN:9780134683416
Author:Ron Larson, Betsy Farber
Publisher:PEARSON

The Basic Practice of Statistics
Statistics
ISBN:9781319042578
Author:David S. Moore, William I. Notz, Michael A. Fligner
Publisher:W. H. Freeman

Introduction to the Practice of Statistics
Statistics
ISBN:9781319013387
Author:David S. Moore, George P. McCabe, Bruce A. Craig
Publisher:W. H. Freeman