Production costs. The graph of the marginal cost function from the production of x thousand bottles of sunscreen per month [where cost C ( x ) is in thousands of dollars per month] is given in the figure. (A) Using the graph shown, describe the shape of the graph of the cost function C ( x ) as x increases from 0 to 8,000 bottles per month. (B) Given the equation of the marginal cost function. C ′ ( x ) = 3 x 2 − 24 x + 53 find the cost function if monthly fixed costs at 0 output are $80,000. What is the cost of manufacturing 4,000 bottles per month? 8,000 bottles per month? (C) Graph the cost function for 0 ≤ x ≤ 8 . [Check the shape of the graph relative to the analysis in part (A).]
Production costs. The graph of the marginal cost function from the production of x thousand bottles of sunscreen per month [where cost C ( x ) is in thousands of dollars per month] is given in the figure. (A) Using the graph shown, describe the shape of the graph of the cost function C ( x ) as x increases from 0 to 8,000 bottles per month. (B) Given the equation of the marginal cost function. C ′ ( x ) = 3 x 2 − 24 x + 53 find the cost function if monthly fixed costs at 0 output are $80,000. What is the cost of manufacturing 4,000 bottles per month? 8,000 bottles per month? (C) Graph the cost function for 0 ≤ x ≤ 8 . [Check the shape of the graph relative to the analysis in part (A).]
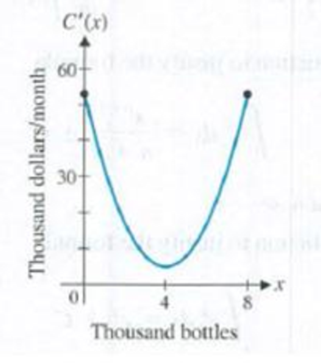
Production costs. The graph of the marginal cost function from the production of x thousand bottles of sunscreen per month [where cost C(x) is in thousands of dollars per month] is given in the figure.
(A) Using the graph shown, describe the shape of the graph of the cost function C(x) as x increases from 0 to 8,000 bottles per month.
(B) Given the equation of the marginal cost function.
C
′
(
x
)
=
3
x
2
−
24
x
+
53
find the cost function if monthly fixed costs at 0 output are $80,000. What is the cost of manufacturing 4,000 bottles per month? 8,000 bottles per month?
(C) Graph the cost function for
0
≤
x
≤
8
. [Check the shape of the graph relative to the analysis in part (A).]
The price p (in dollars) and the demand x for a particular clock radio are related by the equation
x=2000−20p.
(A) Express the price p in terms of the demand x, and find the domain of this function.
(B) Find the revenue R(x) from the sale of x clock radios. What is the domain of R?
(C) Find the marginal revenue at a production level of 1200 clock radios.
(D) Interpret R′(1600)=−60.00.
The total revenue curve of a firm is R(q) = 40q – 12q2 and its average cost A(q) =(1/30q2 − 12.85q + 20 + 400/q ,where q is the firms output. i. Derive an expression C(q) for the firms total cost function. ii. Derive an expression Π(q) for the firms profit function. iii. Is the rate of change of profit increasing or decreasing when the ouput level of the firm is 10 units? iv. Determine the level of output for which the firms profit is maximized. v. What is the firmss maximum profit?
Can you help me find the slope of the graph of the function at the given point?
Fundamentals of Differential Equations and Boundary Value Problems
Knowledge Booster
Learn more about
Need a deep-dive on the concept behind this application? Look no further. Learn more about this topic, subject and related others by exploring similar questions and additional content below.


 College AlgebraAlgebraISBN:9781305115545Author:James Stewart, Lothar Redlin, Saleem WatsonPublisher:Cengage Learning
 Algebra & Trigonometry with Analytic GeometryAlgebraISBN:9781133382119Author:SwokowskiPublisher:Cengage
 Big Ideas Math A Bridge To Success Algebra 1: Stu...AlgebraISBN:9781680331141Author:HOUGHTON MIFFLIN HARCOURTPublisher:Houghton Mifflin Harcourt
 Algebra and Trigonometry (MindTap Course List)AlgebraISBN:9781305071742Author:James Stewart, Lothar Redlin, Saleem WatsonPublisher:Cengage Learning