Introduction to Statistics and Data Analysis
5th Edition
ISBN: 9781305115347
Author: Roxy Peck; Chris Olsen; Jay L. Devore
Publisher: Brooks Cole
bartleby

Videos

Textbook Question
Book Icon
Chapter 4.5, Problem 53E

The authors of the paper “Delayed Time to Defibrillation after In-Hospital Cardiac Arrest” (New England Journal of Medicine [2008]: 9–16) described a study of how survival is related to the length of time it takes from the time of a heart attack to the administration of defibrillation therapy. The following is a statement from the paper:

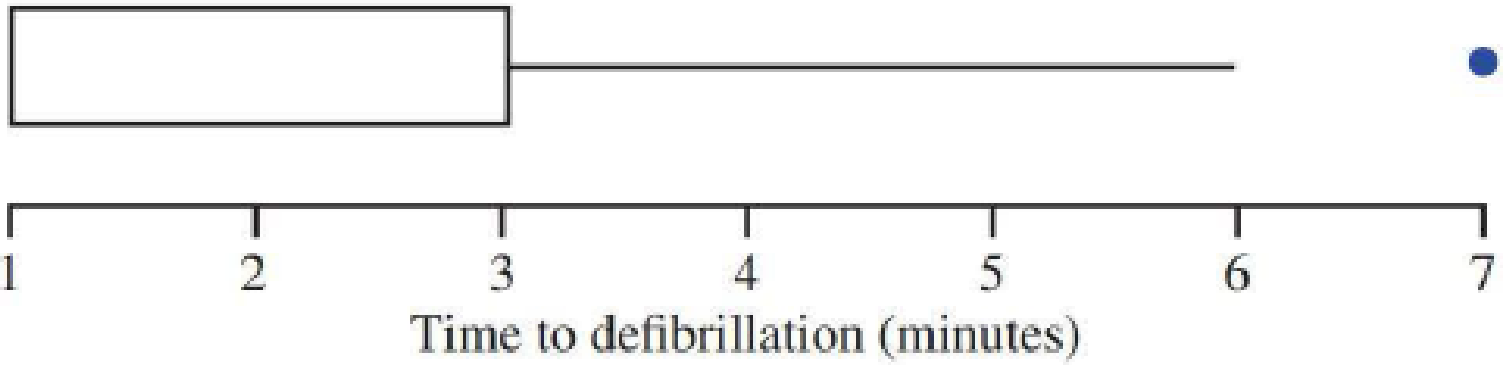
We identified 6789 patients from 369 hospitals who had in-hospital cardiac arrest due to ventricular fibrillation (69.7%) or pulseless ventricular trachycardia (30.3%). Overall, the median time to defibrillation was 1 minute (interquartile range [was] 3 minutes).

Data from the paper on time to defibrillation in minutes) for these 6789 patients was used to produce the Minitab output and boxplot at the bottom of the page.

  1. a. Why is there no lower whisker in the given boxplot?
  2. b. How is it possible for the median, the lower quartile, and the minimum value in the data set to all be equal? (Note—this is why you do not see a median line in the box part of the boxplot.)
  3. c. The authors of the paper considered a time to defibrillation of greater than 2 minutes as unacceptable. Based on the given boxplot and summary statistics, is it possible that the percentage of patients having an unacceptable time to defibrillation is greater than 50%? Greater than 25%? Less than 25%? Explain.
  4. d. Is the outlier shown at 7 a mild outlier or an extreme outlier?

Descriptive Statistics: Time to Defibrillation

Chapter 4.5, Problem 53E, The authors of the paper Delayed Time to Defibrillation after In-Hospital Cardiac Arrest (New , example  1

Chapter 4.5, Problem 53E, The authors of the paper Delayed Time to Defibrillation after In-Hospital Cardiac Arrest (New , example  2

Blurred answer

Chapter 4 Solutions

Introduction to Statistics and Data Analysis

Ch. 4.1 - Houses in California are expensive, especially on...Ch. 4.1 - Consider the following statement: More than 65% of...Ch. 4.1 - A sample consisting of four pieces of luggage was...Ch. 4.1 - Suppose that 10 patients with meningitis received...Ch. 4.1 - A study of the lifetime (in hours) for a certain...Ch. 4.1 - An instructor has graded 19 exam papers submitted...Ch. 4.2 - The following data are costs (in cents) per ounce...Ch. 4.2 - Cost per serving (in cents) for six high-fiber...Ch. 4.2 - Combining the cost-per-serving data for high-fiber...Ch. 4.2 - Prob. 20ECh. 4.2 - The accompanying data are consistent with summary...Ch. 4.2 - The paper referenced in the previous exercise also...Ch. 4.2 - Prob. 23ECh. 4.2 - Prob. 24ECh. 4.2 - The accompanying data on number of minutes used...Ch. 4.2 - Give two sets of five numbers that have the same...Ch. 4.2 - Prob. 27ECh. 4.2 - The U.S. Department of Transportation reported the...Ch. 4.2 - The Ministry of Health and Long-Term Care in...Ch. 4.2 - In 1997, a woman sued a computer keyboard...Ch. 4.2 - The standard deviation alone does not measure...Ch. 4.3 - Based on a large national sample of working...Ch. 4.3 - Prob. 33ECh. 4.3 - Prob. 34ECh. 4.3 - Prob. 35ECh. 4.3 - Fiber content (in grams per serving) and sugar...Ch. 4.3 - Shown here are the number of auto accidents per...Ch. 4.4 - The average playing time of music albums in a...Ch. 4.4 - In a study investigating the effect of car speed...Ch. 4.4 - Prob. 40ECh. 4.4 - Mobile homes are tightly constructed for energy...Ch. 4.4 - Prob. 42ECh. 4.4 - A student took two national aptitude tests. The...Ch. 4.4 - Suppose that your younger sister is applying for...Ch. 4.4 - The report Who Borrows Most? Bachelors Degree...Ch. 4.4 - Prob. 46ECh. 4.4 - Prob. 47ECh. 4.4 - Suppose that your statistics professor returned...Ch. 4.4 - Prob. 49ECh. 4.4 - Suppose that the average reading speed of students...Ch. 4.4 - Prob. 51ECh. 4.4 - The accompanying table gives the mean and standard...Ch. 4.5 - The authors of the paper Delayed Time to...Ch. 4.5 - The paper Portable Social Groups: Willingness to...Ch. 4 - Prob. 55CRCh. 4 - Prob. 56CRCh. 4 - Prob. 57CRCh. 4 - Prob. 58CRCh. 4 - Because some homes have selling prices that are...Ch. 4 - Although bats are not known for their eyesight,...Ch. 4 - Prob. 61CRCh. 4 - Prob. 62CRCh. 4 - Prob. 63CRCh. 4 - Prob. 64CRCh. 4 - Prob. 65CRCh. 4 - Prob. 66CRCh. 4 - Prob. 67CRCh. 4 - Prob. 68CRCh. 4 - Prob. 69CRCh. 4 - Prob. 70CRCh. 4 - Prob. 71CRCh. 4 - Age at diagnosis for each of 20 patients under...Ch. 4 - Suppose that the distribution of scores on an exam...
Knowledge Booster
Background pattern image
Statistics
Learn more about
Need a deep-dive on the concept behind this application? Look no further. Learn more about this topic, statistics and related others by exploring similar questions and additional content below.
Recommended textbooks for you
Text book image
Holt Mcdougal Larson Pre-algebra: Student Edition...
Algebra
ISBN:9780547587776
Author:HOLT MCDOUGAL
Publisher:HOLT MCDOUGAL
Text book image
Calculus For The Life Sciences
Calculus
ISBN:9780321964038
Author:GREENWELL, Raymond N., RITCHEY, Nathan P., Lial, Margaret L.
Publisher:Pearson Addison Wesley,
Text book image
Glencoe Algebra 1, Student Edition, 9780079039897...
Algebra
ISBN:9780079039897
Author:Carter
Publisher:McGraw Hill
Hypothesis Testing using Confidence Interval Approach; Author: BUM2413 Applied Statistics UMP;https://www.youtube.com/watch?v=Hq1l3e9pLyY;License: Standard YouTube License, CC-BY
Hypothesis Testing - Difference of Two Means - Student's -Distribution & Normal Distribution; Author: The Organic Chemistry Tutor;https://www.youtube.com/watch?v=UcZwyzwWU7o;License: Standard Youtube License