
Concept explainers
Videos
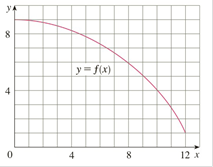
(a) Use six rectangles to find estimates of each type for the area under the given graph of f from
(i)
(ii)
(iii)
(b) Is
(c) Is
(d) Which of the numbers L6,
Want to see the full answer?
Check out a sample textbook solution
Chapter 4 Solutions
CALCULUS FULL TEXT W/ACCESS >BI<
Additional Math Textbook Solutions
Precalculus Enhanced with Graphing Utilities (7th Edition)
Precalculus (10th Edition)
Thomas' Calculus: Early Transcendentals (14th Edition)
Precalculus
University Calculus: Early Transcendentals, Single Variable (3rd Edition)


- Use the table of values you made in part 4 of the example to find the limiting value of the average rate of change in velocity.arrow_forwardr2 = t2 /t2+df = ( 3.569)^2 / ( 3.569)^2+16 =0.4432 = 44.32% Present in a bar chart the difference in the mean number of resolved problems reported by the participants under the two experimental conditions: well-lit room and dimly lit room, and place under the chart the following information: (t = , df = , p< ). Add a title to the bar chart.arrow_forward8 Can you help me with thisarrow_forward
- The scatter plot displays bivarlate data on the outside temperature in degrees Fahrenheit, x, and the corresponding number of beachgoers, y, at a local beach. Temperature and Beachgoers 60 50 30 20 10 55 60 65 70 75 Temperature ("F) 85 Outliers appear to be located at (66, 45) and (85, 15). | The outlier (66, 45) represents 45 beachgoers visiting the beach on a day when the outside temperature was 65°F. The outlier (85, 15) represents 15 beachgoers at the beach on a day when the outside temperature was 85°F. Perhaps on the 85° day, people attended a big event, such as a football game instead of the beach. This could explain why fewer people attended the beach. Likewise, maybe there was a special competition at the beach on the day that the temperature was 66°F. This could explain why more people went to the beach even though it was not very warm. The strong, positive, and linear association indicates that there are more beachgoers on warmer days. The general trend shows that, for…arrow_forwardConsumer Reports provided overall customer satisfaction scores for AT&T, Sprint, T-Mobile, and Verizon cell phone services in major metropolitan areas throughout the United States. The rating for each service reflects the overall customer satisfaction considering a variety of factors such as cost, connectivity problems, dropped calls, static interference, and customer support. A satisfaction scale from 0 to 100 was used with 0 indicating completely dissatisfied and 100 indicating completely satisfied. The ratings for the four cell phone services in 20 metropolitan areas are as shown. Metropolitan Area Atlanta Boston Chicago Dallas Denver Detroit Jacksonville Las Vegas Los Angeles Miami Minneapolis Philadelphia Phoenix San Antonio San Diego San Francisco Seattle St. Louis Tampa Washington AT&T 78 77 79 83 79 81 81 80 74 76 76 80 76 83 77 74 76 82 81 80 Sprint 74 72 73 73 75 73 72 76 73 77 74 74 74 73 75 7 75 74 71 76 76 77 T-Mobile 79 82 78 82 81 85 83 82 76 81 83 79 84 83 80 81 82 82…arrow_forward1. Find the area of the shaded region. The graph to the right depicts IQ scores of adults, and those scores are normally distributed with a mean of 100 and a standard deviation of 15. 75 A graph with a bell-shaped curve, divided into 2 regions by a vertical line. The vertical line extends from the bell curve to the x-axis, and is located on the left half, under the curve. The region on the left of this line is shaded. The x-axis below the vertical line is labeled 75. Question content area bottom The area of the shaded region is enter your response here (Round to four decimal places as needed.) 2. Find the area of the shaded region. The graph to the right depicts IQ scores of adults, and those scores are normally distributed with a mean of 100 and a standard deviation of 15. 83 A symmetric bell-shaped curve is plotted over a horizontal scale. A vertical line runs from the…arrow_forward
- Please show me the steps to completing the attached problem. I am confussed about weighted average in this problem. Thank you!arrow_forward8arrow_forwardFind the area of the shaded region. The graph to the right depicts IQ scores of adults, and those scores are normally distributed with a mean of 100 and a standard deviation of 15. A graph with a bell-shaped curve, divided into 3 regions by 2 lines from top to bottom, one on the left side and one on the right side. The region between the lines is shaded. Moving from left to right, the x-axis below the first line is labeled 75. The x-axis below the second line is labeled 110.arrow_forward

 Trigonometry (MindTap Course List)TrigonometryISBN:9781337278461Author:Ron LarsonPublisher:Cengage Learning
 Algebra & Trigonometry with Analytic GeometryAlgebraISBN:9781133382119Author:SwokowskiPublisher:Cengage
 Functions and Change: A Modeling Approach to Coll...AlgebraISBN:9781337111348Author:Bruce Crauder, Benny Evans, Alan NoellPublisher:Cengage Learning
 Big Ideas Math A Bridge To Success Algebra 1: Stu...AlgebraISBN:9781680331141Author:HOUGHTON MIFFLIN HARCOURTPublisher:Houghton Mifflin Harcourt
 College AlgebraAlgebraISBN:9781305115545Author:James Stewart, Lothar Redlin, Saleem WatsonPublisher:Cengage Learning