
Concept explainers
Videos
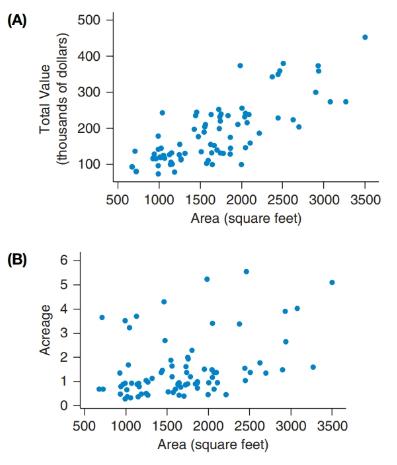
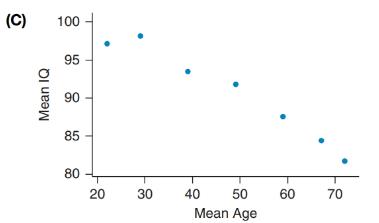
Matching Pick the letter of the graph that goes with each numerical value listed below for the correlation.
Want to see the full answer?
Check out a sample textbook solution
Chapter 4 Solutions
EP INTRODUCTORY STATISTICS-MYSTATLAB
Additional Math Textbook Solutions
The Practice of Statistics for AP - 4th Edition
Elementary Statistics ( 3rd International Edition ) Isbn:9781260092561
Statistics for Business & Economics, Revised (MindTap Course List)
Essentials of Statistics, Books a la Carte Edition (5th Edition)
Basic Business Statistics, Student Value Edition
An Introduction to Mathematical Statistics and Its Applications (6th Edition)


- Explain how to interpret the absolute value of acorrelation coefficient.arrow_forwardExplain the difference between a positive and anegative correlation coefficient.arrow_forwardHeart Disease In a certain country, the number of deaths due to heart disease decreased from 235 in one year to 221 in the next year. What percentage decrease in deaths due to heart disease does this represent?arrow_forward
- DVD Player sales The table shows the number of DVD play-ers sold in a small electronics store in the years 2003-2013. What was the average rate of change of sales between 2003 and 2013? Whatwas the average rate of change of sales between 2003 and 2004? What was the average rate of change of sales between 2004 and 2005? Between which two successive years did DVD player sales increase most quickly?arrow_forwardStock Market The week of September 15, 2008 was one of the most volatile weeks ever for the US stock market. The closing numbers of the Dow Jones Industrial Average each day were: What was the overall change for the week? Was it positive or negative?arrow_forwardUse the model we created using technology in Example 6 to predict the gas consumption in 2011. Is this aninterpolation or an extrapolation?arrow_forward
- Determine from your graph if the data shows a correlation. What would you expect the correlation coefficient to look like (close to +1, -1, or 0)? Explainarrow_forwardA scatterplot of two variables is a picture of the relationship represented in a correlation. Group of answer choices True Falsearrow_forward

 Big Ideas Math A Bridge To Success Algebra 1: Stu...AlgebraISBN:9781680331141Author:HOUGHTON MIFFLIN HARCOURTPublisher:Houghton Mifflin Harcourt
 Glencoe Algebra 1, Student Edition, 9780079039897...AlgebraISBN:9780079039897Author:CarterPublisher:McGraw Hill
 Holt Mcdougal Larson Pre-algebra: Student Edition...AlgebraISBN:9780547587776Author:HOLT MCDOUGALPublisher:HOLT MCDOUGAL
 Functions and Change: A Modeling Approach to Coll...AlgebraISBN:9781337111348Author:Bruce Crauder, Benny Evans, Alan NoellPublisher:Cengage Learning
 Algebra: Structure And Method, Book 1AlgebraISBN:9780395977224Author:Richard G. Brown, Mary P. Dolciani, Robert H. Sorgenfrey, William L. ColePublisher:McDougal Littell