MATLAB: An Introduction with Applications
6th Edition
ISBN: 9781119256830
Author: Amos Gilat
Publisher: John Wiley & Sons Inc
expand_more
expand_more
format_list_bulleted
Question

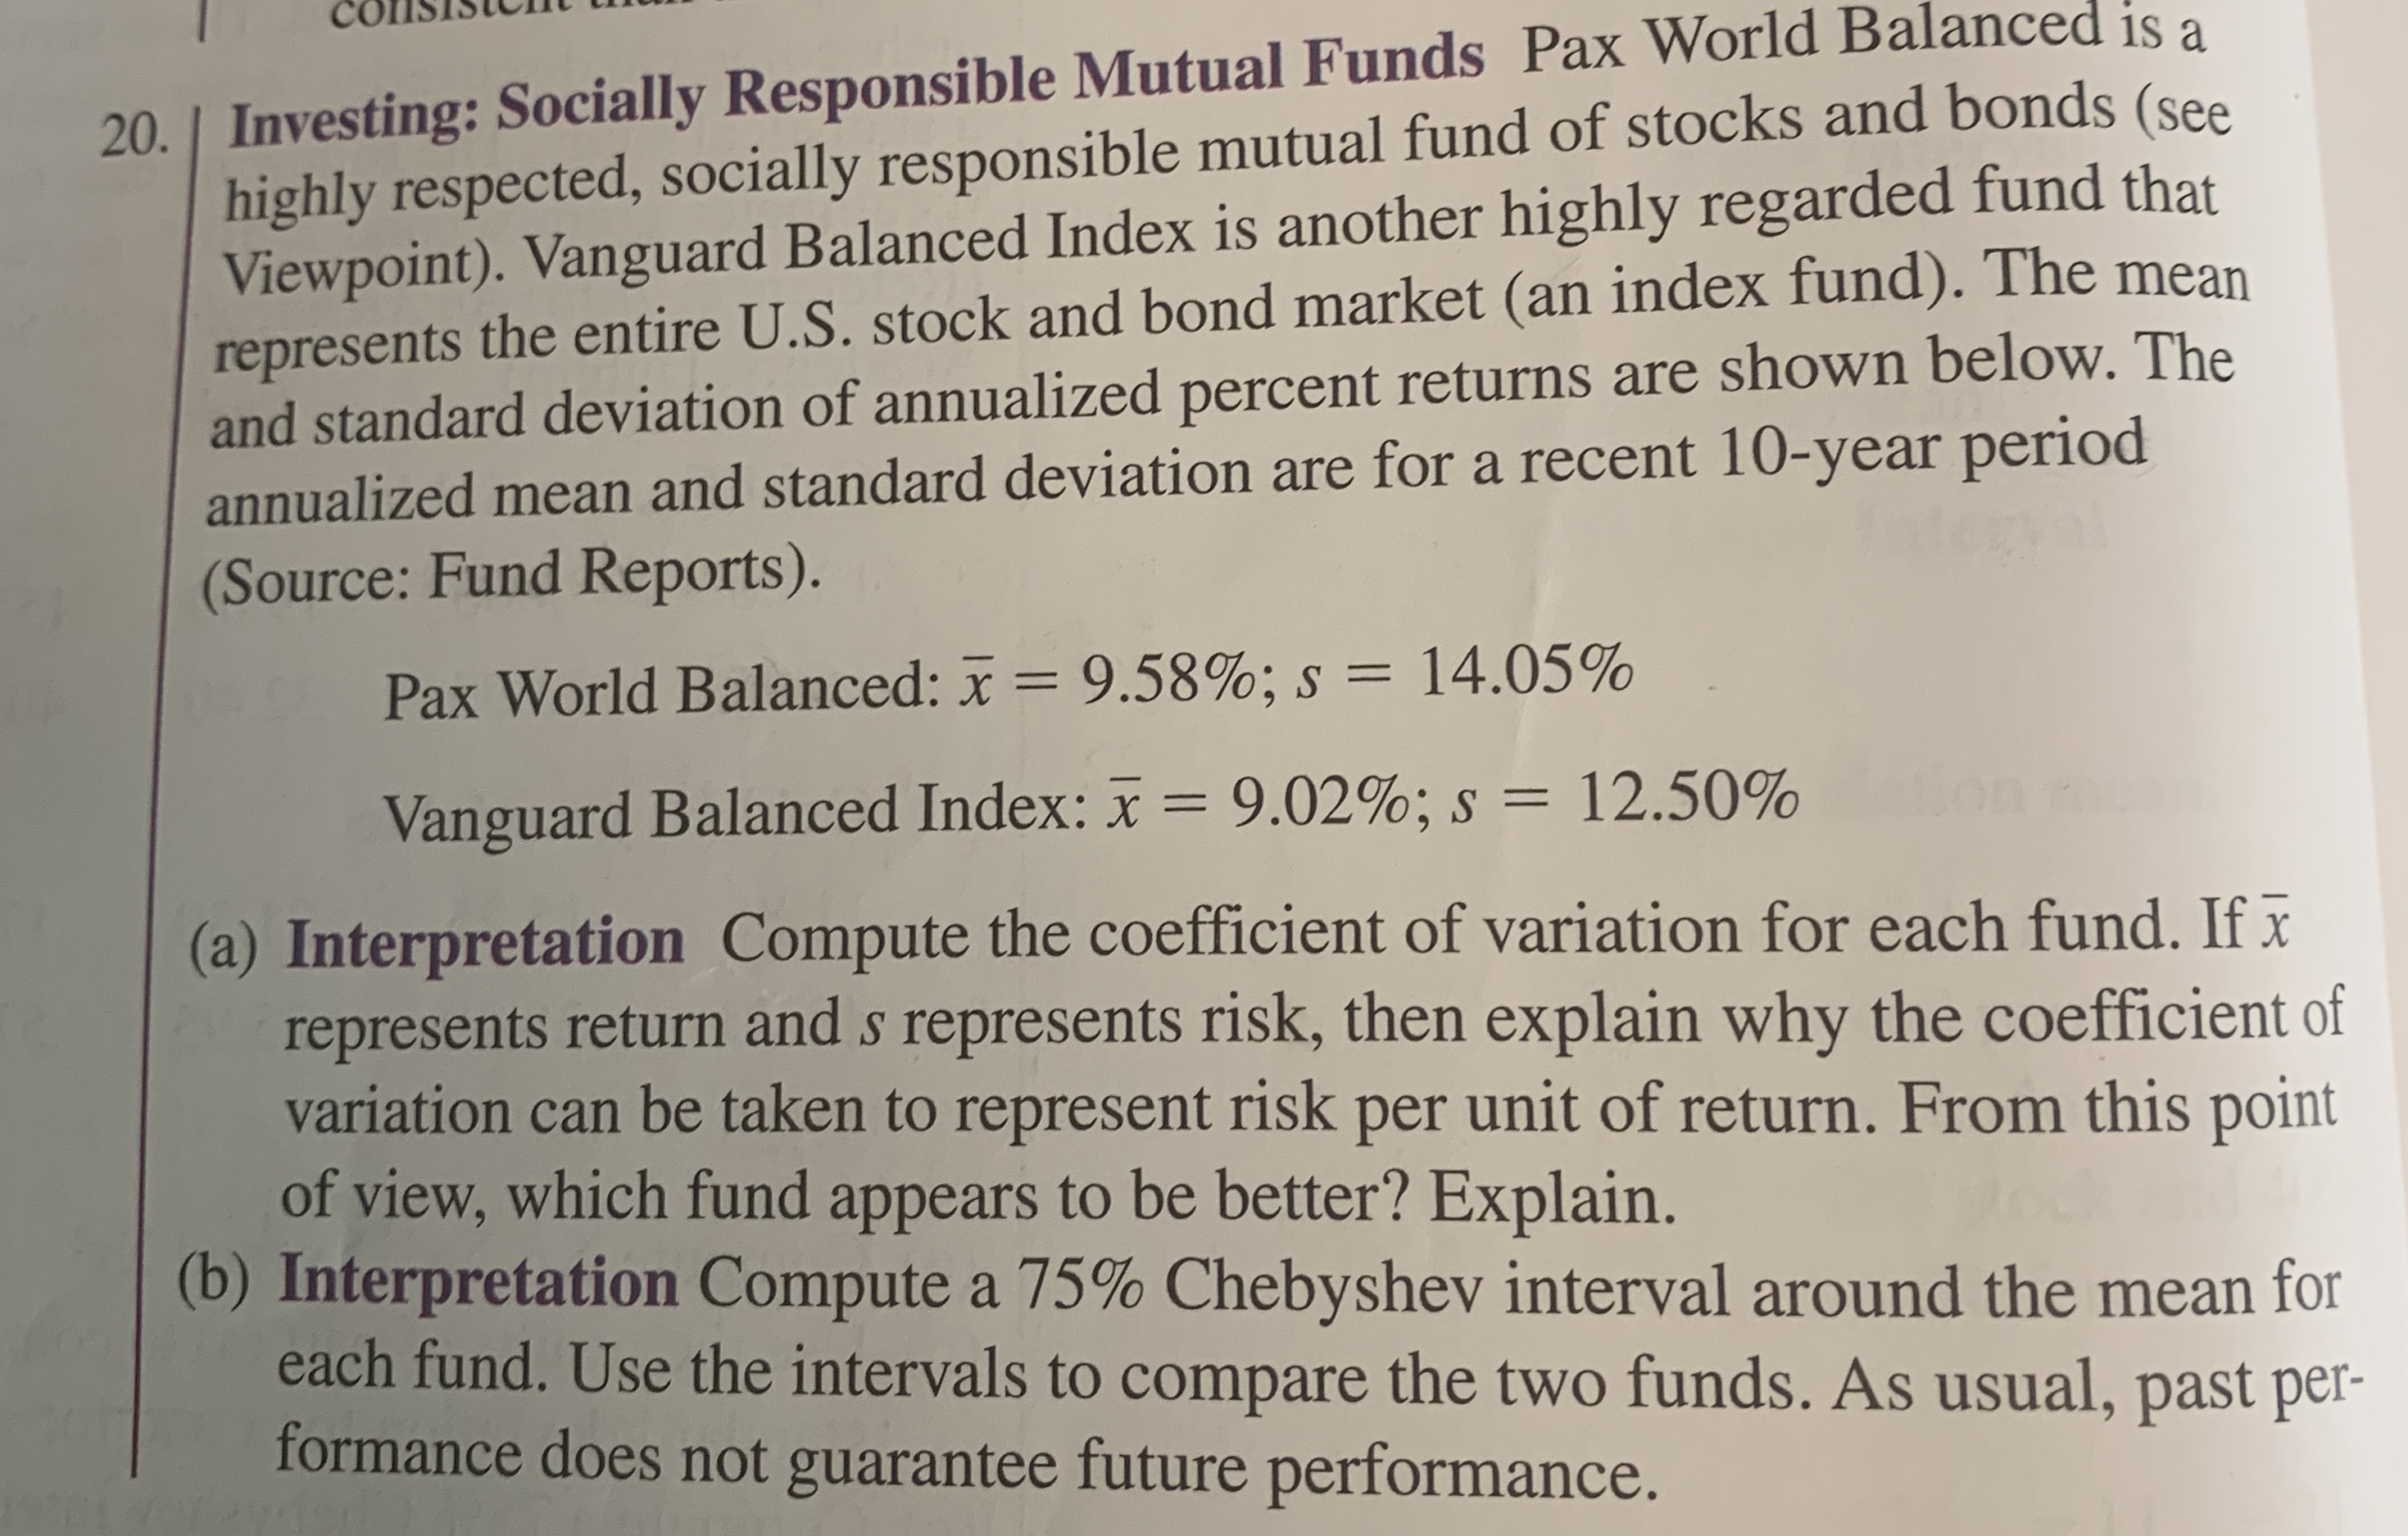
Transcribed Image Text:20. Investing: Socially Responsible Mutual Funds Pax World Balanced is a
highly respected, socially responsible mutual fund of stocks and bonds (see
Viewpoint). Vanguard Balanced Index is another highly regarded fund that
represents the entire U.S. stock and bond market (an index fund). The mean
and standard deviation of annualized percent returns are shown below. The
annualized mean and standard deviation are for a recent 10-year period
(Source: Fund Reports).
Pax World Balanced: x 9.58%; s = 14.05%
Vanguard Balanced Index: x
9.02%; s = 12.50%
(a) Interpretation Compute the coefficient of variation for each fund. Ifx
represents return and s represents risk, then explain why the coefficient of
variation can be taken to represent risk per unit of return. From this point
of view, which fund appears to be better? Explain.
(b) Interpretation Compute a 75% Chebyshev interval around the mean for
each fund. Use the intervals to compare the two funds. As usual, past per-
formance does not guarantee future performance.
Expert Solution
This question has been solved!
Explore an expertly crafted, step-by-step solution for a thorough understanding of key concepts.
This is a popular solution
Trending nowThis is a popular solution!
Step by stepSolved in 7 steps with 5 images

Knowledge Booster
Similar questions
- U.S. Civilian Labor Force (thousands) Year Labor Force Year Labor Force 2007 153,918 2012 155,628 2008 154,655 2013 155,151 2009 153,111 2014 156,238 2010 153,650 2015 157,957 2011 153,995 2016 159,640 1. Fit three trend models: linear, exponential, and quadratic. Which model would offer the most believable forecasts? 2. Make forecasts using the following fitted trend models for years 2017-2019. t Exponential 11 12 13arrow_forward8. Magazine Sales The following table shows the income, measured in thousands of dollars, from sales of a certain magazine at the start of the given year.arrow_forward
Recommended textbooks for you
 MATLAB: An Introduction with ApplicationsStatisticsISBN:9781119256830Author:Amos GilatPublisher:John Wiley & Sons Inc
 Probability and Statistics for Engineering and th...StatisticsISBN:9781305251809Author:Jay L. DevorePublisher:Cengage Learning
 Statistics for The Behavioral Sciences (MindTap C...StatisticsISBN:9781305504912Author:Frederick J Gravetter, Larry B. WallnauPublisher:Cengage Learning
 Elementary Statistics: Picturing the World (7th E...StatisticsISBN:9780134683416Author:Ron Larson, Betsy FarberPublisher:PEARSON
 The Basic Practice of StatisticsStatisticsISBN:9781319042578Author:David S. Moore, William I. Notz, Michael A. FlignerPublisher:W. H. Freeman
 Introduction to the Practice of StatisticsStatisticsISBN:9781319013387Author:David S. Moore, George P. McCabe, Bruce A. CraigPublisher:W. H. Freeman

MATLAB: An Introduction with Applications
Statistics
ISBN:9781119256830
Author:Amos Gilat
Publisher:John Wiley & Sons Inc

Probability and Statistics for Engineering and th...
Statistics
ISBN:9781305251809
Author:Jay L. Devore
Publisher:Cengage Learning

Statistics for The Behavioral Sciences (MindTap C...
Statistics
ISBN:9781305504912
Author:Frederick J Gravetter, Larry B. Wallnau
Publisher:Cengage Learning

Elementary Statistics: Picturing the World (7th E...
Statistics
ISBN:9780134683416
Author:Ron Larson, Betsy Farber
Publisher:PEARSON

The Basic Practice of Statistics
Statistics
ISBN:9781319042578
Author:David S. Moore, William I. Notz, Michael A. Fligner
Publisher:W. H. Freeman

Introduction to the Practice of Statistics
Statistics
ISBN:9781319013387
Author:David S. Moore, George P. McCabe, Bruce A. Craig
Publisher:W. H. Freeman