
Concept explainers
Videos
Mental Health
The Chinese Mini-Mental Status Test (CMMS) consists of 114 items intended to identify people with Alzheimer’s disease and senile dementia among people in China [14]. An extensive clinical evaluation of this instrument was performed, whereby participants were interviewed by psychiatrists and nurses and a definitive diagnosis of dementia was made. Table 3.13 shows the results obtained for the subgroup of people with at least some formal education.
TABLE 3.13 Relationship of clinical dementia to outcome on the Chinese Mini-Mental Status Test
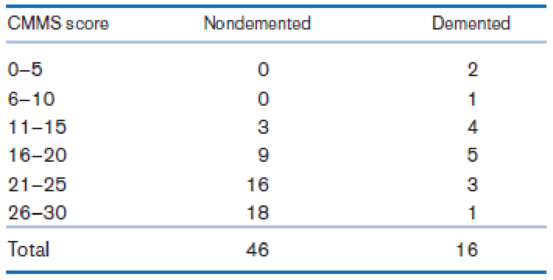
The cutoff value of 20 on the CMMS used to identify people with dementia is arbitrary. Suppose we consider changing the cutoff. What are the sensitivity and specificity if cutoffs of 5, 10, 15, 20, 25, or 30 are used? Make a table of your results.

Trending nowThis is a popular solution!

Chapter 3 Solutions
EBK FUNDAMENTALS OF BIOSTATISTICS


- What is meant by the sample space of an experiment?arrow_forwardWhat is an experiment?arrow_forwardA research team is interested in determining if there is a relationship between death anxiety and religiosity. Subjects completed a death anxiety scale (high score = high anxiety) and also completed a checklist designed to measure an individual's degree of religiosity (belief in a particular religion, regular attendance at religious services, number of times per week they regularly pray, etc.) (high score = greater religiosity). What statistical test is most suitable to answer the research objective? a. Chi-Square Test b. Correlation Coefficient c. t-test d. ANOVAarrow_forward
- If you are conducting a study on the academic performance of students who are registered members of any of the university's sports and culturals clubs. Would you consider this study to require a quantitative or qualitative approach? Justify your answerarrow_forwardTwenty samples of students from the first year were taken for the study related to student emotional intelligence (EQ) in a university. The researcher has collected the data for a few variables: gender, academic performance, and emotional intelligence (EQ) test score. EQ Training and Coaching(T & C) Programme EQ Score No Gender CGPA (Before Attend T & C) EQ Score (After Attend T & C) 1 Male 2.10 444 526 2 Female 4.00 780 862 3 Male 2.30 475 557 4 Male 2.40 490 572 5 Female 3.80 755 837 6 Female 3.90 766 848 7 Male 2.70 540 622 Male 3.10 623 705 9 Male 2.90 600 682 10 Male 3.00 620 702 11 Male 2.50 505 590 12 Female 3.20 640 725 13 Male 2.60 523 608 14 Female 3.40 700 785 15 Female 3.50 710 795 16 Female 3.60 726 811 17 Female 3.70 740 825 18 Male 2.80 550 635 19 Female 3.30 685 770 20 Male 2.20 460 545 Table 1 Remarks: (1) Range of CGPA: 0 to 4 (2) Range of EQ Score: 0 to 900 To analysis the relationship between students' academic performance and emotional intelligence (EQ) in the…arrow_forwardTwenty samples of students from the first year were taken for the study related to student emotional intelligence (EQ) in a university. The researcher has collected the data for a few variables: gender, academic performance, and emotional intelligence (EQ) test score. EQ Training and Coaching(T & C) Programme EQ Score No Gender CGPA (Before Attend T & C) EQ Score (After Attend T & C) 1 Male 2.10 444 526 2 Female 4.00 780 862 3 Male 2.30 475 557 4 Male 2.40 490 572 5 Female 3.80 755 837 6 Female 3.90 766 848 7 Male 2.70 540 622 Male 3.10 623 705 9 Male 2.90 600 682 10 Male 3.00 620 702 11 Male 2.50 505 590 12 Female 3.20 640 725 13 Male 2.60 523 608 14 Female 3.40 700 785 15 Female 3.50 710 795 16 Female 3.60 726 811 17 Female 3.70 740 825 18 Male 2.80 550 635 19 Female 3.30 685 770 20 Male 2.20 460 545 Table 1 Remarks: (1) Range of CGPA: 0 to 4 (2) Range of EQ Score: 0 to 900 Use the sample data from table 1, perform hypothesis testing to determine whether there is a difference in the…arrow_forward
- Asian Americans are a heterogeneous group often coined as one in national and state estimates of health data. Recent studies, however, have shown that some Asian American subgroups are more likely to die early due to cardiovascular disease and more likely to report metabolic syndrome. An epidemiologist wants to study the age of diagnosis of type 2 diabetes among two Asian American subgroups (Asian Indians, Koreans). The researcher had the following two questions: Is the mean age of diagnosis for type 2 diabetes among Asian Indians different than 55 years? Is the mean age of diagnosis of type 2 diabetes different between Koreans and Asian Indians? The epidemiologist should conduct which types of tests to answer the above 2 questions? None two-sample t test after checking for equal variance and a one sample t-test One-sample t test and two-sample t test after checking for equal variance One-sample t test and ANOVA One-sample t test and ANOVAarrow_forward2 Researchers examined the relationship between interpersonal violence and health in college-age women. The researchers administered a psychological distress questionnaire which produced a score on a scale of 0-12. What would be an appropriate measure of central tendency to consider for this variable?arrow_forwardI collected data on levels of anxiety after receiving three types of therapies (CBT, psycho education, and psycho analysis). Below are the anxiety scores for 9 patients. Is there a difference in anxiety based on treatment type ? CBT: 3, 2, 0 Psycho Education: 8, 8, 9 Psycho Analysis: 10, 12, 12 (Look at the table)arrow_forward
- I will give upvotearrow_forwardWhat method(observational, designed, retrospective) is mostly used in gathering a data in a high school research? And how is it used?arrow_forwardA biologist wished to study the effects of ethanol on sleep time. A sample of 80 rats, matched for age and other characteristics, was selected, and each rat was given an oral injection having a particular concentration of ethanol per body weight. The rapid eye movement (REM) sleep time for each rat was then recorded for a 24-hour period. The results are summarized in the side-by-side boxplots below. How is the amount of ethanol given related to the median REM sleep time? Does the amount of ethanol given affect the variability of REM sleep time? What amount of ethanol given leads to the most skewed distribution of sleep times? Is the distribution of REM sleep times for the rats given 2 g/kg ethanol symmetric, skewed left, or skewed right?arrow_forward
 Glencoe Algebra 1, Student Edition, 9780079039897...AlgebraISBN:9780079039897Author:CarterPublisher:McGraw Hill
 Big Ideas Math A Bridge To Success Algebra 1: Stu...AlgebraISBN:9781680331141Author:HOUGHTON MIFFLIN HARCOURTPublisher:Houghton Mifflin Harcourt
 College Algebra (MindTap Course List)AlgebraISBN:9781305652231Author:R. David Gustafson, Jeff HughesPublisher:Cengage Learning