
Concept explainers
Videos
Genetics, Obstetrics
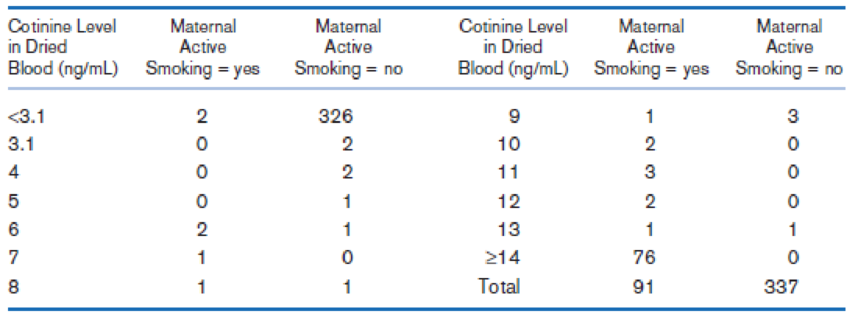
Precise quantification of smoking during pregnancy is difficult in retrospective studies. Routinely collected blood specimens from newborns for screening purposes may provide a low-cost method to objectively measure maternal smoking close to the time of delivery. Serum cotinine is an important biomarker of recent smoking. A study was performed comparing cotinine levels in dried blood spots in newborns with those in umbilical cord blood (the gold standard) among 428 newborns in the California Genetic Screening Program (Yang et al. [11]). The lowest detection limit for dried blood spot cotinine was 3.1 ng/mL. The data in Table 3.9 were presented relating dried blood spot cotinine determinations to umbilical cord blood cotinine determinations.
Suppose a cutoff of ≥ 5 ng/mL is proposed as a criterion for testing positive based on dried blood spot cotinine levels.
What is the sensitivity using this cut-point?
TABLE 3.9 Distribution of Cotinine Level in Dried Blood Spots from Newborns by Maternal Active Smoking Status* close to the time of delivery among 428 babies delivered in California, 2001–2003
Want to see the full answer?
Check out a sample textbook solution
Chapter 3 Solutions
EBK FUNDAMENTALS OF BIOSTATISTICS


- What is an experiment?arrow_forwardBinge-watching a television show might not be the best way to enjoy a television series (Horvath et al., 2017). Participants in an experiment were in a group that either watched an entire t.v. series during daily one-hour sessions or watched all the episodes during a single binge session. Participants were asked to rate their enjoyment of the t.v. series on a scale of 0-100. Data like those observed by the author are listed below. Binge-watched Daily-watched 87 84 71 100 73 87 86 97 78 92 Is there a difference in the level of enjoyment based on whether the series was binge-watched or watched on a daily basis? Use a two-tailed test at the α = 0.05 level of significance?arrow_forwardplease do the full problem!arrow_forward
- Efforts by airlines to improve on-time arrival rates are showing results. Boston.com reports that in the first 10 months of 2012 on-time arrival rates at U.S. airports were the highest they have been since 2003. During this period 82% of flights landed within 15 minutes of their scheduled time. Are there differences among the major airlines? The data in Sheet 35 show the number of on-time arrivals for samples of flight taken from seven major U.S. airlines in 2012. Using a 0.05 level of significance, what is the p-value and what is your conclusion? Sheet 35 Arrivals American Airlines Continental Airlines Delta Airlines JetBlue Airlines Southwest Airlines United Airlines US Airways On-time 83 54 96 60 69 66 68 Late 16 18 21 22 23 15 12 99 72 117 82 92 81 80 Select one: a) Chi-square statistic = 4.32, p-value = 0.034, reject the null hypothesis, there is a statistically significant differences in the proportion of on-time arrivals b) Chi-square statistic = 7.370,…arrow_forwardTourism is extremely important to the economy of Florida. Hotel occupancy is an often-reported measure of visitor volume and visitor activity (Orlando Sentinel, May 19, 2018). Hotel occupancy data for February in two consecutive years are as follows. Current Year 1,476 1,800 Occupied Rooms Total Rooms 1,422 1,800 a. Formulate the hypothesis test that can be used to determine whether there has been an increase in the proportion of rooms occupied over the one-year period. Let P₁= population proportion of rooms occupied for current year P2 population proportion of rooms occupied for previous year - P2 less than or equal to 0 greater than 0 Ho P1 Ha P1 P2 b. What is the estimated proportion of hotel rooms occupied each year (to 2 decimals)? Current year .80 X Previous Year .77 c. Conduct a hypothesis test. What is the p-value (to 4 decimals)? Use Table 1 from Appendix B. Previous Year p-value = 0.0166 Using a 0.05 level of significance, what is your conclusion? We can conclude that there…arrow_forwardTourism is extremely important to the economy of Florida. Hotel occupancy is an often-reported measure of visitor volume and visitor activity (Orlando Sentinel, May 19, 2018). Hotel occupancy data for February in two consecutive years are as follows. Current Year 1,394 1,700 Occupied Rooms Total Rooms a. Formulate the hypothesis test that can be used to determine whether there has been an increase in the proportion of rooms occupied over the one-year period. Let p₁ = population proportion of rooms occupied for current year P2 = population proportion of rooms occupied for previous year 0.82 Previous Year 1,404 1,800 Ho: P1 P2 less than or equal to 0 Ha P₁ P2 greater than 0 b. What is the estimated proportion of hotel rooms occupied each year (to 2 decimals)? Current year Previous Year c. Conduct a hypothesis test. What is the p-value (to 4 decimals)? Use Table 1 from Appendix B. 0.78arrow_forward
- Do sports drinks help prevent cramps in endurance sports? At the end of a marathon, officials will ask runners if they drank water or a sports drink during the race, along with whether or not they suffered any cramps. Is this an observational study or experiment?arrow_forwardTourism is extremely important to the economy of Florida. Hotel occupancy is an often-reported measure of visitor volume and visitor activity (Orlando Sentinel, May 19, 2018). Hotel occupancy data for February in two consecutive years are as follows. Current Year Previous Year Occupied Rooms 1,584 1,445 Total Rooms 1,800 1,700 a. Formulate the hypothesis test that can be used to determine whether there has been an increase in the proportion of rooms occupied over the one-year period. Let pi population proportion of rooms occupied for current year P2 = population proportion of rooms occupied for previous year Ho : P1 - P2 - Select your answer - Ha : P1 – P2 - Select your answer - b. What is the estimated proportion of hotel rooms occupied each year (to 2 decimals)? Current year Previous Year c. Conduct a hypothesis test. What is the p-value (to 4 decimals)? Use Table 1 from Appendix B. p-value = Using a 0.05 level of significance, what is your conclusion? We -Select your answer - that…arrow_forwardA survey recently reported that the mean national annual expenditure for inpatient andoutpatient services of all persons over 64 years of age was $5,423 with a standarddeviation of $979. A random sample of 352 persons over age 64 living in Sudbury had anaverage expense of $5,516. We want to test whether the mean inpatient and outpatient expense of all Sudbury residents over age 64 is higher than the national average of $5,423. Calculate the P-value for this test.arrow_forward
- To help assess the health risks of second-hand smoke, the levels of cotinine (a metabolite of nicotine) were measured in mmol/l in the urine of seven subjects prior to exposure to second-hand smoke and shortly after a two-hour exposure to secondary cigarette smoke. Did the exposure significantly increase the cotinine level? What will be the appropriate statistical analysis to use in this problem? a. z-Test for Comparing Two Means from Independent Populations b. t-Test for Comparing Two Means when the Samples are Dependent c. z-test for comparing the difference between two proportions d. t-Test for Comparing Two Means from Independent Samples e. F-test in Comparing the Difference Between Two Variancesarrow_forwardPart 1 of 4 A doctor in Oklahoma City wants to know whether the average life span for heart disease patients at four hospitals in the city differ. The data below represents the life span, in years, of heart disease patients from each hospital. Perform an ANOVA test with a 10% level of significance to test whether the average life span of heart disease patients in Oklahoma City differs depending on the hospital that treats them Life Span of Patients Treated at Hospital 1: 8.1, 1.2, 7, 11.5, 21, 2, 15.3, 19.2, 10.5, 15.4, 12.7, 15.3, 12.1, 7.5, 11.4, 16.4, 26.7, 14.6, 1.5, 16.3, 12.6, 0.8, 18.2, 4.2, 9.6, 21, 16.3, 2.7 Life Span of Patients Treated at Hospital 2: 17.6, 11.6, 16.8, 5.2, 6.7, 3.2, 13.8, 12.5, 0.9, 6, 14.3, 1.8, 14.8, 10, 5.8, 15.2, 10, 3.7, 11.4, 21.6, 12.9, 0.5, 9.2, 13.9, 10.9 Life Span of Patients Treated at Hospital 3: 8.5, 2.3, 11, 7.4, 14.8, 5.8, 11, 3.4, 10.9, 1.1, 5.9, 21.6, 12.5, 0.1, 15.5, 15.4, 0.8, 7.7, 5.6, 12, 7.1 Life Span of Patients Treated at Hospital 4:…arrow_forwardWhat other options are there to guarantee the accuracy of the data collected in the field?arrow_forward
 Glencoe Algebra 1, Student Edition, 9780079039897...AlgebraISBN:9780079039897Author:CarterPublisher:McGraw Hill
 Big Ideas Math A Bridge To Success Algebra 1: Stu...AlgebraISBN:9781680331141Author:HOUGHTON MIFFLIN HARCOURTPublisher:Houghton Mifflin Harcourt