
Videos
Case Problem 2 Motion Picture Industry
The motion picture industry is a competitive business. More than 50 studios produce several
hundred new motion pictures each year, and the financial success of the motion pictures
varies considerably. The opening weekend gross sales, the total gross sales, the number of
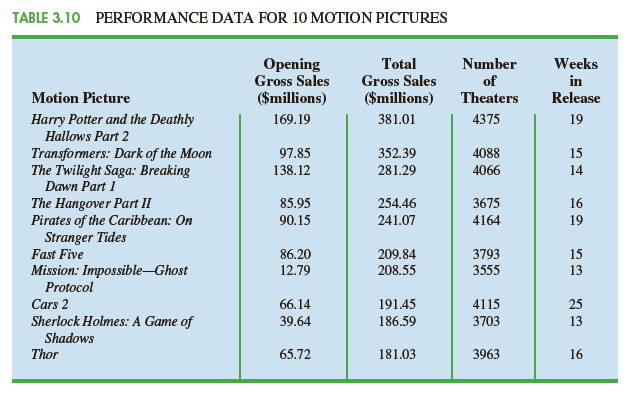 theaters the movie was shown in, and the number of weeks the motion picture was in release are common variables used to measure the success of a motion picture. Data on the top 100 grossing motion pictures released in 2011 (Box Office Mojo website, March 17, 2012) are contained in the DATAfile named 2011Movies. Table 3.10 shows the data for the first 10 motion pictures in this file. Note that some movies, such as War Horse, were released late in 2011 and continued to run in 2012.
Managerial Report
Use the numerical methods of
3. Descriptive statistics showing the relationship between total gross sales and each of the other variables. Discuss.
Want to see the full answer?
Check out a sample textbook solution
Chapter 3 Solutions
ESSEN OF MOD BUS STAT(LL) W/MIND TAP


- Cholesterol Cholesterol in human blood is necessary, but too much can lead to health problems. There are three main types of cholesterol: HDL (high-density lipoproteins), LDL (low-density lipoproteins), and VLDL (very low-density lipoproteins). HDL is considered “good” cholesterol; LDL and VLDL are considered “bad” cholesterol. A standard fasting cholesterol blood test measures total cholesterol, HDL cholesterol, and triglycerides. These numbers are used to estimate LDL and VLDL, which are difficult to measure directly. Your doctor recommends that your combined LDL/VLDL cholesterol level be less than 130 milligrams per deciliter, your HDL cholesterol level be at least 60 milligrams per deciliter, and your total cholesterol level be no more than 200 milligrams per deciliter. (a) Write a system of linear inequalities for the recommended cholesterol levels. Let x represent the HDL cholesterol level, and let y represent the combined LDL VLDL cholesterol level. (b) Graph the system of inequalities from part (a). Label any vertices of the solution region. (c) Is the following set of cholesterol levels within the recommendations? Explain. LDL/VLDL: 120 milligrams per deciliter HDL: 90 milligrams per deciliter Total: 210 milligrams per deciliter (d) Give an example of cholesterol levels in which the LDL/VLDL cholesterol level is too high but the HDL cholesterol level is acceptable. (e) Another recommendation is that the ratio of total cholesterol to HDL cholesterol be less than 4 (that is, less than 4 to 1). Identify a point in the solution region from part (b) that meets this recommendation, and explain why it meets the recommendation.arrow_forwardThe top three sources of oil imports for the United States in the same year were Saudi Arabia, Mexico, and Canada. The three top countries accounted for 47% of oil imports. The United States imported 1.8% more from Saudi Arabia than they did from Mexico, and 1.7% more from Saudi Arabia than they did from Canada. What percent of the United States oil imports were from these three countries?[29]arrow_forwardName the four parts of a mathematical system. HINT: See Section 1.3arrow_forward
- Box Office Hits The table below shows the highest grossing movie of the given year. The amount is the domestic box office gross, in millions of dollars. Year Movie Amount(millions) 2006 Pirates of the Caribbean: Dead Mans chest 423.32 2007 Spider-Man 3 336.53 2008 The Dark Knight 533.35 2009 Avatar 760.51 2010 Toy Story 3 415.00 2011 Harry Potter and the Deathly Hallows: Part 2 381.01 2012 The Avengers 623.28 2013 The Hunger Games: Catching Fire 424.67 2014 American Sniper 350.13 Let M=M(y) denote the highest grossing movie in year y, and let B=B(y) denote the gross for that movie. a. Give the values of M(2014) and B(2014). b. Use the functional notation to indicate the amount for the movie with the highest gross in 2013.arrow_forwardA statistics instructor at a large western university would like to examine the relationship (if any) between the number of optional homework problems students do during the semester and their final course grade. She randomly selects 12 students for study and asks them to keep track of the number of these problems completed during the course of the semester. At the end of the class each student's total marks is recorded along with their final grade. The data follow in Table 2. Table 2 Problem Course Grade 51 62 58 68 62 66 65 66 67 68 76 72 77 73 78 72 78 78 84 73 85 76 91 75 For this setting identify the response variable. i. i. For this setting, identify the predictor variable. Compute the linear correlation coefficient for this data set iv. ii. Classify the direction and strength of the correlation Test the hypothesis for a significant linear correlation, a = 0.05 What is the valid prediction range for this setting? Use the regression equation to predict a student's final course…arrow_forwardA corporation that operates five suppliers of athletic apparel in a region provides merchandise for a shoe company. The shoe company recently sought information from the five plants. One variable for which data were collected was the total money (in dollars) the company spent on medical support for its employees in the first three months of the year. Data on number of employees at the plants are also shown below. Complete parts a and b. Medical Employees $7,788 121 $14,371 409 $12,776 256 $6,874 107 $3,907 O 68 a. Compute the weighted mean medical payments for these five plants using the numbers of employees as the weights. The weighted mean is $. (Round to the nearest dollar as needed.)arrow_forward
- If certain plants contain phytochemicals and regulate moisture, while others do not, then there is no difference in the number of signs of herbivory instances. independent variable: dependent variable:arrow_forwardThe school sports department is considering reducing the number of sports they offer. Students are allowed to participate in only one sport, and every year fewer than 300 students sign up for one sport. The department wants to compare the number of participants in each sport in the last two years. The results of the enrollment data is graphed below. Which category of sport dropped the most in enrollment in 2017 compared to 2016? 120 100 I 2016 2017 80 60 40 20 Football O football Swimming Track & O basketball O volleyball O swimming O softball O track & field Basketball Volleyball Softball Fieldarrow_forwardSouthwest Airlines had 81.1 million domestic boardings in a recent year, followed by Delta Airlines with 79.4 million, American Airlines with 72.6 million, United Airlines with 56.3 million, Northwest Airlines with 43.3 million, US Airways with 37.8 million, and Continental Airlines with 31.5 million, according to T-100 Domestic Market. Construct a pie chart to depict this information. List down the variable of the above data. Describe whether each variable are qualitative or quantitative data? Explain your answer. Describe the level of measurement for the variables. Explain your answer.arrow_forward
- File Home Insert Draw Page Layout Despite the growth in digital entertainment, the nation's 400 amusement parks have managed to hold on to visitors. A manager collects data on the number of visitors (in millions) to amusement parks in the United States. A portion of the data is shown in the accompanying table. 10 v ... v X v fx B2 Year Visitors A B D 2000 312 1 Year Visitors 2001 315 2 2000 312 2007 345 3 2001 315 4 2002 364 SOURCE: International Association of Amusement Parks and Attractions. 5 2003 370 6. 2004 332 7 2005 314 picture Click here for the Excel Data File 8 2006 355 9 2007 345 b-1. Estimate a linear trend model and an exponential trend model for the sample. (Round your answers to 2 decimal places.) 10 11 12 Variable Linear Trend Exponential Trend 13 Intercept 14 15 Standard Error 16 17 18arrow_forwardExamine the chart below. This shows the proportion of vote-share received by the GOP (Republican Party) in the 2012 and 2016 Presidential elections for 1055 counties from Midwestern states. Each data point represents a unique county. Which of the following statements about this chart are true? Click all that apply.arrow_forwardBicycling, the world's leading cycling magazine, reviews hundreds of bicycles throughout the year. Their "Road-Race" category contains reviews of bikes used by riders primarily interested in racing. One of the most important factors in selecting a bike for racing is the weight of the bike. The following data show the weight (pounds) and price ($) for 10 racing bikes reviewed by the magazine (Bicycling website). DATA file Brand FELT F5 PINARELLO Paris ORBEA Orca GDR EDDY MERCKX EMX-7 BH RC1 Ultegra BH Ultralight 386 CERVELO S5 Team GIANT TCR Advanced 2 WILIER TRIESTINA Gran Turismo (to 3 decimals) Weight Price ($) 17.8 16.1 14.9 15.9 Did the estimated regression equation provide a good fit? The estimated regression equation provided a - Select your answer - fit. c. Predict the price for a bike that weighs 15 pounds. (to whole number) 2100 6250 8370 6200 17.2 13.1 16.2 17.1 17.6 SPECIALIZED S-Works Amira SL4 14.1 8000 a. Use the data to develop an estimated regression equation that could…arrow_forward

 Functions and Change: A Modeling Approach to Coll...AlgebraISBN:9781337111348Author:Bruce Crauder, Benny Evans, Alan NoellPublisher:Cengage Learning
 Holt Mcdougal Larson Pre-algebra: Student Edition...AlgebraISBN:9780547587776Author:HOLT MCDOUGALPublisher:HOLT MCDOUGAL
 Glencoe Algebra 1, Student Edition, 9780079039897...AlgebraISBN:9780079039897Author:CarterPublisher:McGraw Hill
 Algebra & Trigonometry with Analytic GeometryAlgebraISBN:9781133382119Author:SwokowskiPublisher:Cengage