
Concept explainers
Videos
Internet Use The following graph shows the percentage of U.S. residents who used the Internet at home in 2010 as a function of income (the data points) and a logistic model of these data (the curve).50
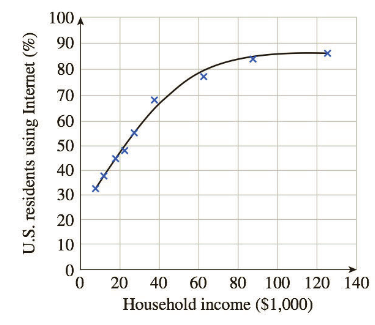
The logistic model is given by
a. According to the model, what percentage of extremely wealthy people used the Internet at home?
b. For low incomes the logistic model is approximately exponential. Which exponential model best approximates
c. According to the model, 50% of individuals with what household income used the Internet at home in 2010? (Round the answer to the nearest $1,000.)

Trending nowThis is a popular solution!

Chapter 2 Solutions
Student Solutions Manual for Waner/Costenoble's Applied Calculus, 7th


- What situations are best modeled by a logistic equation? Give an example, and state a case for why the example is a good fit.arrow_forwardSales of a video game released in the year 2000 took off at first, but then steadily slowed as time moved on. Table 4 shows the number of games sold, in thousands, from the years 20002010. a. Let x represent time in years starting with x=1 for the year 2000. Let y represent the number of games sold in thousands. Use logarithmic regression to fit a model to these data. b. If games continue to sell at this rate, how many games will sell in 2015? Round to the nearest thousand.arrow_forwardWhat type (s) of translation(s), if any, affect the range of a logarithmic function?arrow_forward
- World Population The following table shows world population N, in billions, in the given year. Year 1950 1960 1970 1980 1990 2000 2010 N 2.56 3.04 3.71 4.45 5.29 6.09 6.85 a. Use regression to find a logistic model for world population. b. What r value do these data yield for humans on planet Earth? c. According to the logistic model using these data, what is the carrying capacity of planet Earth for humans? d. According to this model, when will world population reach 90 of carrying capacity? Round to the nearest year. Note: This represents a rather naive analysis of world population.arrow_forwardWhat type (s) of translation (s), if any, affect thedomain ofa logarithmic function?arrow_forwardWeight Versus Height The following data show the height h, in inches, and weight w, in pounds, of an average adult male. h 61 62 66 68 70 72 74 75 w 131 133 143 149 155 162 170 175 a Make a power model for weight versus height. b According to the model from part a, what percentage increase in weight can be expected if height is increased by 10?arrow_forward
- DVD Player sales The table shows the number of DVD play-ers sold in a small electronics store in the years 2003-2013. What was the average rate of change of sales between 2003 and 2013? Whatwas the average rate of change of sales between 2003 and 2004? What was the average rate of change of sales between 2004 and 2005? Between which two successive years did DVD player sales increase most quickly?arrow_forwardThe US. import of wine (in hectoliters) for several years is given in Table 5. Determine whether the trend appearslinear. Ifso, and assuming the trend continues, in what year will imports exceed 12,000 hectoliters?arrow_forwardThe U.S. Census tracks the percentage of persons 25 years or older who are college graduates. That data forseveral years is given in Table 4[14]. Determine whether the trend appears linear. If so, and assuming the trendcontinues. in what year will the percentage exceed 35%?arrow_forward
- The population of a lake of fish is modeled by the logistic equation P(t)=16,1201+25e0.75t, where t is time inyears. To the unrest hundredth, how manyyears will it take the lake to reach 80% of its carrying capacity?For the following exercises, use a graphing utility to create a scatter diagram of the data given in the table.Observe the shape of the scatter diagram to determine whether the data is best described by an exponential,logarithmic, or logistic model. Then use the appropriate regression feature to find an equation that models thedata. When necessary, round values to five decimal places.arrow_forwardLong-Term Data and the Carrying Capacity This is a continuation of Exercise 13. Ideally, logistic data grow toward the carrying capacity but never go beyond this limiting value. The following table shows additional data on paramecium cells. t 12 13 14 15 16 17 18 19 20 N 610 513 593 557 560 522 565 517 500 a. Add these data to the graph in part b of Exercise 13. b. Comment on the relationship of the data to the carrying capacity. Paramecium Cells The following table is adapted from a paramecium culture experiment conducted by Cause in 1934. The data show the paramecium population N as a function of time t in days. T 2 3 5 6 8 9 10 11 N 14 34 94 189 330 416 507 580 a. Use regression to find a logistic model for this population. b. Make a graph of the model you found in part a. c. According to the model you made in part a, when would the population reach 450?arrow_forwardThe American Food Dollar The following table shows the percentage P=P(d) of the American food dollar that was spent on eating away from home at restaurants, for example as function of the date d. d=Year P=Precentspentawayfromhome 1969 25 1989 30 2009 34 a. Find P(1989) and explain what it means. b. What does P(1999) mean? Estimate its value. c. What is the average rate of change per year in percentage of the food dollar spent away from home for the period from 1989 to 2009? d. What does P(2004) mean? Estimate its value. Hint: Your calculation in part c should be useful. e. Predict the value of P(2014) and explain how you made your estimate.arrow_forward
 Algebra and Trigonometry (MindTap Course List)AlgebraISBN:9781305071742Author:James Stewart, Lothar Redlin, Saleem WatsonPublisher:Cengage Learning
 Functions and Change: A Modeling Approach to Coll...AlgebraISBN:9781337111348Author:Bruce Crauder, Benny Evans, Alan NoellPublisher:Cengage Learning
 Algebra & Trigonometry with Analytic GeometryAlgebraISBN:9781133382119Author:SwokowskiPublisher:Cengage
 College AlgebraAlgebraISBN:9781305115545Author:James Stewart, Lothar Redlin, Saleem WatsonPublisher:Cengage Learning
 Glencoe Algebra 1, Student Edition, 9780079039897...AlgebraISBN:9780079039897Author:CarterPublisher:McGraw Hill