
Concept explainers
Videos
Constructing Frequency Distributions. In Exercises 11–18, use the indicated data to construct the frequency distribution. (The data for Exercises 13–16 can be downloaded at TriolaStats.com.)
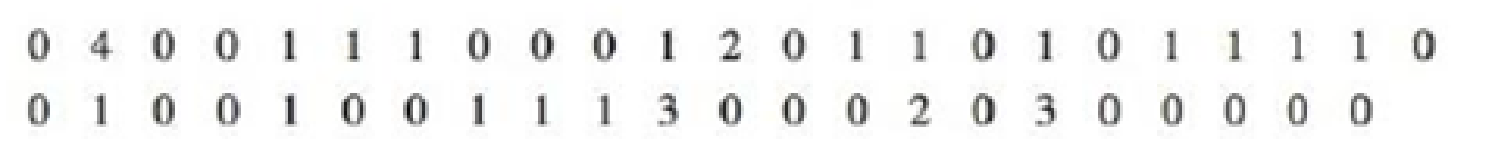
12. Tornadoes Listed below are the F-scale intensities of recent tornadoes in the United States. Construct a frequency distribution. Do the intensities appear to have a

Learn your wayIncludes step-by-step video

Chapter 2 Solutions
Pearson eText for Essentials of Statistics -- Instant Access (Pearson+)
Additional Math Textbook Solutions
Essentials of Statistics, Books a la Carte Edition (5th Edition)
Intro Stats, Books a la Carte Edition (5th Edition)
Introductory Statistics
Elementary Statistics: Picturing the World (6th Edition)
Statistics for Psychology
Statistics: The Art and Science of Learning from Data (4th Edition)


- If a researcher wants to find out the average monthly expenses of all university students in Edmonton, this average would be an example of ________ . a. samplecross out b. statisticcross out c. populationcross out d. parameterarrow_forwardHow to construct the frequency distributions? Write down the steps.arrow_forwardDiscuss the meaning of central tendency. Provide examples as needed.arrow_forward
- Construct one table that includes relative frequencies based on the frequency distributions shown below, then compare the amounts of tar in nonfiltered and filtered cigarettes. Do the cigarette filters appear to be effective? (Hint: The filters reduce the amount of tar ingested by the smoker.) Click the icon to view the frequency distributions. Complete the relative frequency table below. Relative Relative Frequency Frequency Tar (mg) (Nonfiltered) (Filtered) 4-8 % % % % % % % % % % 9-13 14-18 19-23 24-28 29-33 34-38 (Simplify your answers.) wan exa C Frequency Distributions Tar (mg) in Nonfiltered Cigarettes Frequency 14-18 19-23 24-28 29-33 34-38 8 N 2 1 -462 14 CID Tar (mg) in Filtered Cigarettes 4-8 9-13 14-18 19-23 Frequency 1 1 7 16 4 D - X k answer 85°F Clear OParrow_forward3aarrow_forwardBased on the hourly incomes (in US dollars) of employees in two different branches at Citibank, which set of incomes has the most variability? You do not have to calculate anything, but you can if you want to. Just take a look at the incomes and determine which set has the most variability based on the definition.arrow_forward
- Construct one table that includes relative frequencies based on the frequency distributions shown below, then compare the amounts of tar in nonfiltered and filtered cigarettes effective? (Hint: The filters reduce the amount of tar ingested by the smoker.) Click the icon to view the frequency distributions. ..... Complete the relative frequency table below. Relative Relative Frequency Frequency Tar (mg) (Nonfiltered) (Filtered) 6-9 10 - 13 % 14-17 % 18-21 % 22- 25 % % 26 - 29 % 30 - 33 % (Simplify your answers.) Do cigarette filters appear to be effective? A. Yes, because the relative frequency of the higher tar classes is greater for nonfiltered cigarettes. B. No, because the relative frequency of the higher tar classes is greater for filtered cigarettes. C. No, because the relative frequencies for each are not substantially different. O D. This cannot be determined. MacBook DII F9 80 000 000 F8 F7 F5 F6 F4 esc F2 F3 F1 & @ # %24arrow_forwardFrequency Distributions Tar (mg) in Nonfiltered Cigarettes Frequency 14-19 1 20-25 26-31 32 - 37 38-43 2 14 7 1 Tar (mg) in Filtered Cigarettes Frequency 2-7 8-13 14 - 19 20-25 3377 12 0arrow_forwardConstruct one table that includes relative frequencies based on the frequency distributions shown below, then compare the amounts of tar in nonfiltered and filtered cigarettes. Do the cigarette filters appear to be effective? (Hint: The filters redu the amount of tar ingested by the smoker.) Click the icon to view the frequency distributions. Complete the relative frequency table below. Relative Relative Frequency Tar (mg) (Nonfiltered) 0 % Frequency (Filtered) 4 - 9 8 % 10 - 15 0 % 4 % 16 - 21 4 % 24 % 22 - 27 4 % 64 % 28 – 33 52 % 0 % 34 - 39 28 % 0 % 40 - 45 12 % 0 % (Simplify your answers.) Do cigarette filters appear to be effective? O A. No, because the relative frequency of the higher tar classes is greater for filtered cigarettes. B. Yes, because the relative frequency of the higher tar classes is greater for nonfiltered cigarettes. O c. No, because the relative frequencies for each are not substantially different. D. This cannot be determined.arrow_forward
- Section 3.1, question 2arrow_forwardConstruct one table that includes relative frequencies based on the frequency distributions shown below, then compare the amounts of tar in nonfiltered and filtered cigarettes. Do the cigarette filters appear to be effective? (Hint: The filters reduce the amount of tar ingested by the smoker.) Click the icon to view the frequency distributions. Complete the relative frequency table below. Relative Frequency (Filtered) 0.15% 0.20% 0.25% 0.12% 0.15% 0.08% 0.05% Relative Frequency Tar (mg) (Nonfiltered) 4-7 % 8-11 % % 12-15 16 - 19 20-23 24 - 27 % % % % 28-31 (Simplify your answers.)arrow_forwardConstruct one table that includes relative frequencies based on the frequency distributions shown below, then compare the amounts of tar in nonfiltered and filtered cigarettes. Do the cigarette filters appear to be effective? (Hint: The filters reduce the amount of tar ingested by the smoker. Click the icon to view the frequency distributions. Complete the relative frequency table below. Relative Frequency (Filtered) 3% Relative Frequency Tar (mg) (Nonfiltered) 2-7 0% 0% 8-13 14-19 1% 0% 14% 20-25 26-31 32-37 38-43 2% (Simplify your answers.) 8% D 5% 11% 25 % 0% 0% 0% Frequency Distributions Tar (mg) in Nonfiltered Cigarettes Frequency 14-19 1 20-25 0 26-31 32-37 38-43 14 8 2 Print Tar (mg) in Filtered Cigarettes Frequency 3 2-7 8-13 2 14-19 6 14 20-25 Done D - Xarrow_forward
 MATLAB: An Introduction with ApplicationsStatisticsISBN:9781119256830Author:Amos GilatPublisher:John Wiley & Sons Inc
 Probability and Statistics for Engineering and th...StatisticsISBN:9781305251809Author:Jay L. DevorePublisher:Cengage Learning
 Statistics for The Behavioral Sciences (MindTap C...StatisticsISBN:9781305504912Author:Frederick J Gravetter, Larry B. WallnauPublisher:Cengage Learning
 Elementary Statistics: Picturing the World (7th E...StatisticsISBN:9780134683416Author:Ron Larson, Betsy FarberPublisher:PEARSON
 The Basic Practice of StatisticsStatisticsISBN:9781319042578Author:David S. Moore, William I. Notz, Michael A. FlignerPublisher:W. H. Freeman
 Introduction to the Practice of StatisticsStatisticsISBN:9781319013387Author:David S. Moore, George P. McCabe, Bruce A. CraigPublisher:W. H. Freeman