
Concept explainers
Videos
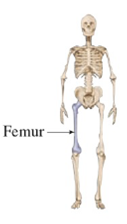
Femur Length and Height Anthropologists use a linear model that relates femur length to height. The model allows an anthropologist to determine the height of an individual when only a partial skeleton (including the femur) is found. In this problem we find the model by analyzing the data on femur length and height for the eight males given in the table.
(a) Make a
(b) Find and graph a linear function that models the data.
(c) An anthropologist finds a femur of length
 |
|
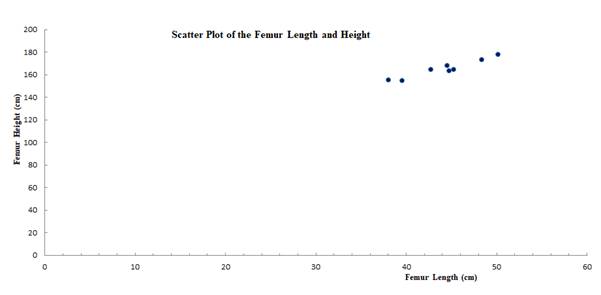
(a)
To make:
A scatter plot of the data given below:
| Femur length (cm) |
Height (cm) |
| 50.1 | 178.5 |
| 48.3 | 173.6 |
| 45.2 | 164.8 |
| 44.7 | 163.7 |
| 44.5 | 168.3 |
| 42.7 | 165.0 |
| 39.5 | 155.4 |
| 38.0 | 155.8 |
Answer to Problem 1P
Solution:
Explanation of Solution
Approach:
A mathematical model is a mathematical representation of an equation or process. Mathematical models are used to predict or estimate the required output.
Scatter plots are the two dimensional graph that represent the coordinate values of the plotted points.
Calculation:
Given:
| Femur length (cm) |
Height (cm) |
| 50.1 | 178.5 |
| 48.3 | 173.6 |
| 45.2 | 164.8 |
| 44.7 | 163.7 |
| 44.5 | 168.3 |
| 42.7 | 165.0 |
| 39.5 | 155.4 |
| 38.0 | 155.8 |
Taking the femur length as

(b)
To find:
The linear function that models the data and graph the function of the scatter plot.
Answer to Problem 1P
Solution:
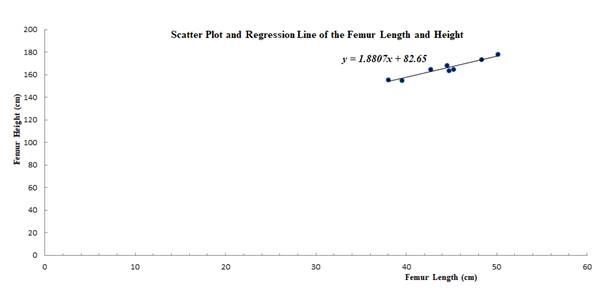
The linear function of the data is found as
Explanation of Solution
Approach:
A mathematical model is a mathematical representation of an equation or process. Mathematical models are used to predict or estimate the required output.
Scatter plots are the two dimensional graph that represent the coordinate values of the plotted points.
Calculation:
Given:
| Femur length (cm) |
Height (cm) |
| 50.1 | 178.5 |
| 48.3 | 173.6 |
| 45.2 | 164.8 |
| 44.7 | 163.7 |
| 44.5 | 168.3 |
| 42.7 | 165.0 |
| 39.5 | 155.4 |
| 38.0 | 155.8 |
The scatter plot and the graph of the linear function that models the data are plotted as shown below:

The linear function of the data is found as
(c)
To find:
The height of the femur of length
Answer to Problem 1P
Solution:
The height of the femur was
Explanation of Solution
Approach:
A mathematical model is a mathematical representation of an equation or process. Mathematical models are used to predict or estimate the required output.
Scatter plots are the two dimensional graph that represent the coordinate values of the plotted points.
Calculation:
From the data, we find that function is
Substituting the value of
Thus, the height of the femur was
Want to see more full solutions like this?
Chapter 1 Solutions
Algebra and Trigonometry (MindTap Course List)


- Sound Speed in Oceans Marine scientists use a linear model for the speed c of sound in the oceans as a function of the salinity S at a fixed depth and temperature. In the following table, one scientist recorded data for c and S at a depth of 500 meters and a temperature of 15 degrees Celsius. Here c is measured in meters per second and S in part per thousand. Salinity S Sound speed c 35.0 1515.36 35.6 1516.08 36.2 1516.80 36.8 1517.62 37.4 1518.24 a. Looking over the table, the scientist realizes that one of the entries for sound speed is in error. Which entry is it, and what is the correct speed? b. Explain in practical terms the meaning of the slope of the linear model for c in terms of S at the given depth and temperature. c. Calculate c39 and explain in practical terms what it means.arrow_forwardEmployee Turnover The percentage of employees who cease their employment during a year is referred to as employee turnover, and it is a serious issue for businesses. The following table shows the cost, in millions of dollars, to Walmart for a given employee turnover percentage in a year.13 E = employee turnover 10 20 30 40 C = cost 250 400 550 700 a. Show that the data can be modeled by a linear function. b. Find the slope of the linear function. c. Find a linear model for the data. d. Use the result from part c to find the cost to Walmart if employee turnover is 33 in a year.arrow_forwardTree Diameter and Age To estimate ages of trees, forest rangers use a linear model that relates tree diameter to age. The model is useful because tree diameter is much easier to measure than tree age which requires special tools for extracting a representative cross section of the tree and counting rings. To find the model, use the data in the table, which were collected for a certain variety of oaks. a Make a scatter plot of the data. b Find and graph a linear function that models the data. c Use the model to estimate the age of an oak whose diameter is 18 in. Diameter in. Age years 2.5 15 4.0 24 6.0 32 8.0 56 9.0 49 9.5 76 12.5 90 15.5 89arrow_forward
- Demand for Soft Drinks A convenience store manager notices that sales of soft drink are higher on hotter days, so he assembles the data in the table. (a) Make a scatter plot of the data. (b) Find and graph a linear function that models the data. (c) Use the model to predict soft drink sales if the temperature is 95Farrow_forwardTuition at American Public Universities This is a continuation of Exercise 6. The following table shows the average yearly in-state tuition and required fees, in dollars, charged by four-year American public universities in the school year ending in the given year. Date Average tuition 2012 8318 2013 8595 2014 8872 2015 9149 2016 9426 a. Show that these data can be modeled by a linear function, and find its formula. b. What is the slope for the linear function modeling tuition and required fees for public universities? c. What is the slope of the linear function modeling tuition and required fees for private universities? Note: See Exercise 6. d. Explain what the information in parts b and c tells you about the rate of increase in tuition in public versus private institutions. e. Which type of institution shows the larger percentage increase from 2015 to 2016? 6. Tuition at American Private Universities The following table shows the average yearly tuition and required fees, in dollars, charged by four-year American private nonprofit universities in the school year ending in the given year. Date Average tuition 2012 27, 870 2013 29, 004 2014 30, 138 2015 31, 272 2016 32, 406 a. Show that these data can be modeled by a linear function, and find its formula. b. Plot the data points and add the graph of the linear formula you found in part a. c. What prediction does this formula give for average tuition and fees at four-year American private nonprofit universities for the academic year ending in 2021?arrow_forwardManufacturing Cost The manager of a furniture factory finds that it costs 2200 to produce 100 chairs in one day and 4800 to produce 300 chairs in one day. a Assuming that the relationship between cost and the number of chairs produced is linear, find a linear function C that models the cost of producing x chairs in one day. b Draw a graph of C. What is the slope of this line? c At what rate does the factorys cost increase for every additional chair produced?arrow_forward
- Demand for Soft Drinks A convenience stores manager notices that sales of soft drinks are higher on hotter days, so he assembles the data in the table. a Make a scatter plot of the data. b Find and graph a linear function that models the data. c Use the model to predict soft drink sales if the temperature is 95. High temperature Number of cans sold 55 340 58 335 64 410 68 460 70 450 75 610 80 735 84 780arrow_forward6. Tuition at American Private Universities The following table shows the average yearly tuition and required fees, in dollars, charged by four-year American private nonprofit universities in the school year ending in the given year. Date Average tuition 2012 27,870 2013 29,004 2014 30,138 2015 31,272 2016 32,406 a. Show that these data can be modeled by a linear function, and find its formula. b. Plot the data points and add the graph of the linear formula you found in part a. c. What prediction does this formula give for average tuition and fees at four-year American private nonprofit universities for the academic year ending in 2021?arrow_forwardPharmacology The numbers of prescriptions P (in thousands) filled at two pharmacies from 2012 through 2016 are shown in the table. (a) Use a graphing utility to create a scatter plot of the data for pharmacy A and find a linear model. Let t represent the year, with t=12 corresponding to 2012. Repeat the procedure for pharmacy B. (b) Assume that the models in part (a) can be used to represent future years. Will the number of prescriptions filled at pharmacy A ever exceed the number of prescriptions filled at pharmacy B? If so, when?arrow_forward
 Algebra and Trigonometry (MindTap Course List)AlgebraISBN:9781305071742Author:James Stewart, Lothar Redlin, Saleem WatsonPublisher:Cengage Learning
 College AlgebraAlgebraISBN:9781305115545Author:James Stewart, Lothar Redlin, Saleem WatsonPublisher:Cengage Learning
 Functions and Change: A Modeling Approach to Coll...AlgebraISBN:9781337111348Author:Bruce Crauder, Benny Evans, Alan NoellPublisher:Cengage Learning
 Algebra & Trigonometry with Analytic GeometryAlgebraISBN:9781133382119Author:SwokowskiPublisher:Cengage