Thinking Like an Engineer: An Active Learning Approach (3rd Edition)
3rd Edition
ISBN: 9780133593211
Author: Elizabeth A. Stephan, David R. Bowman, William J. Park, Benjamin L. Sill, Matthew W. Ohland
Publisher: PEARSON
expand_more
expand_more
format_list_bulleted
Textbook Question
Chapter 18, Problem 10RQ
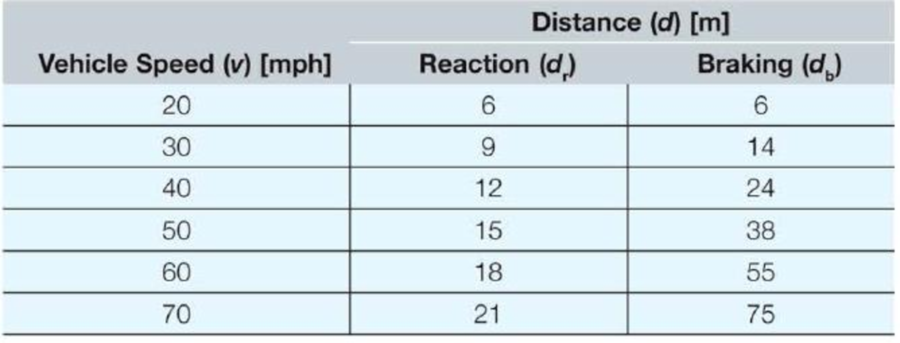
When one tries to stop a car, both the reaction time of the driver and the braking time must be considered. Create a proper plot of the following data.

Expert Solution & Answer
Want to see the full answer?
Check out a sample textbook solution
Students have asked these similar questions
Water enters the rigid, covered tank shown in Figure P3.2 with a volumetric flow rate of 0.32L/s. The water line has an inside diameter of 6.3 cm. The air vent on the tank has an inside diameterof 4.5 cm. The water is at a temperature of 30°C and the air in the tank is at atmospheric pressure(1 atm) and 30°C. Determine the air velocity leaving the vent at the instant shown in the figure
Using method of sections, determine the force in member
BC, HC, and HG. State if these members are in tension or
compression.
2 kN
A
5 kN
4 kN
4 kN
3 kN
H
B
C
D
E
3 m
F
2 m
-5 m 5 m-
G
5 m 5 m-
Determine the normal stresses σn and σt and the shear stress τnt at this point if they act on the rotated stress element shown
Chapter 18 Solutions
Thinking Like an Engineer: An Active Learning Approach (3rd Edition)
Ch. 18.1 - a. Write an input statement to ask for the users...Ch. 18.1 - Prob. 2CCCh. 18.1 - Prob. 3CCCh. 18.2 - Assume that the variable M is stored in the...Ch. 18.2 - Prob. 5CCCh. 18 - Write a MATLAB statement that results in the input...Ch. 18 - You are writing code that is part of a purchasing...Ch. 18 - Prob. 3ICACh. 18 - Prob. 4ICACh. 18 - Prob. 5ICA
Ch. 18 - Assume that a three-element row vector v already...Ch. 18 - The tiles on the space shuttle are constructed to...Ch. 18 - The specific gravity of acetic acid (vinegar) is...Ch. 18 - Write a MATLAB program that will allow a user to...Ch. 18 - Write a program that will allow the user to type a...Ch. 18 - In order to calculate the pressure in a flask,...Ch. 18 - Write a program that will allow the user to type...Ch. 18 - Write a MATLAB program that will ask users to...Ch. 18 - Write a program that asks a user to enter, one at...Ch. 18 - Joules first law, also known as the Joule effect,...Ch. 18 - Create a proper plot of the following set of...Ch. 18 - Prob. 17ICACh. 18 - You want to create a graph showing the theoretical...Ch. 18 - The decay of a radioactive isotope can be...Ch. 18 - Create a proper plot of the theoretical voltage...Ch. 18 - Plot the following functions as assigned by your...Ch. 18 - Plot the following functions as assigned by your...Ch. 18 - If an object is heated, the temperature of the...Ch. 18 - The resistance of a typical carbon film resistor...Ch. 18 - Today, most traffic lights have a delayed green,...Ch. 18 - Cadmium sulfide (CdS) is a semiconducting material...Ch. 18 - Your supervisor has assigned you the task of...Ch. 18 - Three different diodes were tested: a constant...Ch. 18 - If a hot liquid in a container is left to cool,...Ch. 18 - You are an engineer working for M M / Mars...Ch. 18 - 1. The specific gravity of gold is 19.3. Write a...Ch. 18 - An unmanned X-43A scramjet test vehicle has...Ch. 18 - A rod on the surface of Jupiter's moon Callisto...Ch. 18 - The Eco-Marathon is an annual competition...Ch. 18 - Write a function and program to determine the mass...Ch. 18 - Prob. 6RQCh. 18 - You are part of an engineering firm on contract...Ch. 18 - Prob. 8RQCh. 18 - Prob. 9RQCh. 18 - When one tries to stop a car, both the reaction...Ch. 18 - Prob. 11RQCh. 18 - Prob. 12RQCh. 18 - Prob. 13RQCh. 18 - Prob. 14RQCh. 18 - Prob. 15RQCh. 18 - Prob. 16RQCh. 18 - Prob. 17RQCh. 18 - Prob. 18RQCh. 18 - Prob. 19RQCh. 18 - Prob. 20RQCh. 18 - Prob. 21RQCh. 18 - Prob. 22RQCh. 18 - Prob. 23RQCh. 18 - Prob. 24RQCh. 18 - Prob. 25RQCh. 18 - Prob. 26RQCh. 18 - Prob. 27RQCh. 18 - Prob. 28RQCh. 18 - Download the weekly retail gasoline and diesel...Ch. 18 - A sample of the data provided in the Microsoft...Ch. 18 - An Excel file named DartTosses.xlsx has one...
Additional Engineering Textbook Solutions
Find more solutions based on key concepts
Determine the moment reactions at the supports A and B. Use the method of integration. El is constant.
Mechanics of Materials (10th Edition)
Which of the following statements will cause an error? a. x = 17 b. 17 = x c. x = 99999 d. x = '17'
Starting Out with Python (4th Edition)
1.2 Explain the difference between geodetic and plane
surveys,
Elementary Surveying: An Introduction To Geomatics (15th Edition)
Porter’s competitive forces model: The model is used to provide a general view about the firms, the competitors...
Management Information Systems: Managing The Digital Firm (16th Edition)
When comparing two quantities of a class type to see whether they are equal, should you use == or the method eq...
Java: An Introduction to Problem Solving and Programming (8th Edition)
State whether each of the following is true or false. If false, explain why. The expression ((x y) (a b)) is ...
Java How to Program, Early Objects (11th Edition) (Deitel: How to Program)
Knowledge Booster
Learn more about
Need a deep-dive on the concept behind this application? Look no further. Learn more about this topic, mechanical-engineering and related others by exploring similar questions and additional content below.Similar questions
- Using method of joints, determine the force in each member of the truss and state if the members are in tension or compression. A E 6 m D 600 N 4 m B 4 m 900 Narrow_forwardQuestion 5. The diagram below shows a mass suspended from a tie supported by two horizontal braces of equal length. The tie forms an angle "a" of 60° to the horizontal plane, the braces form an angle 0 of 50° to the vertical plane. If the mass suspended is 10 tonnes, and the braces are 10m long, find: a) the force in the tie; & b) the force in the braces Horizontal Braces, Tie Massarrow_forward= MMB 241 Tutorial 2.pdf 1 / 3 75% + + Tutorial z Topic: Kinematics of Particles:-. QUESTIONS 1. Use the chain-rule and find y and ŷ in terms of x, x and x if a) y=4x² b) y=3e c) y = 6 sin x 2. The particle travels from A to B. Identify the three unknowns, and write the three equations needed to solve for them. 8 m 10 m/s 30° B x 3. The particle travels from A to B. Identify the three unknowns, and write the three equations needed to solve for them. A 40 m/s 20 m B 1arrow_forward
- 3 m³/s- 1 md 45° V 1.8 mr 2mrarrow_forward= MMB 241 Tutorial 2.pdf 3/3 75% + + 6. A particle is traveling along the parabolic path y = 0.25 x². If x = 8 m, vx=8 m/s, and ax= 4 m/s² when t = 2 s, determine the magnitude of the particle's velocity and acceleration at this instant. y = 0.25x² -x 7. Determine the speed at which the basketball at A must be thrown at the angle of 30° so that it makes it to the basket at B. 30° -x 1.5 m B 3 m -10 m- 8. The basketball passed through the hoop even though it barely cleared the hands of the player B who attempted to block it. Neglecting the size of the ball, determine the 2arrow_forwardAdhesives distribute loads across the interface, whereas fasteners create areas of localized stresses. True or Falsearrow_forward
- A continuous column flash system is separating 100 kmol/h of a saturated liquid feed that is 45 mol% methanol and 55 mol% water at 1.0 atm. Operate with L/V = 1.5 and the outlet bottoms at xN = 0.28. Find the values of FL, FV, y1, and the number of equilibrium stages required. Find the value of Q used to vaporize FV. For a normal flash with the same feed and the same V/F, find the values of x and y.arrow_forwardA beer still is being used to separate ethanol from water at 1.0 atm. The saturated liquid feed flow rate is F = 840.0 kmol/h. The feed is 44.0 mol% ethanol. The saturated vapor steam is pure water with ratio of steam flow rate S to feed rate, S/F = 2/3. We desire a bottoms product that is 4.0 mol% ethanol. CMO is valid. Find the mole fraction of ethanol in the distillate vapor, yD,E. Find the number of equilibrium stages required. If the feed is unchanged and the S/F ratio is unchanged, but the number of stages is increased to a very large number, what is the lowest bottoms mole fraction of ethanol that can be obtained?arrow_forward3.1 Convert the following base-2 numbers to base-10: (a) 1011001, (b) 110.0101, and (c) 0.01011.arrow_forward
- Consider the forces acting on the handle of the wrench in (Figure 1). a) Determine the moment of force F1={−F1={−2i+i+ 4 jj −−8k}lbk}lb about the zz axis. Express your answer in pound-inches to three significant figures. b) Determine the moment of force F2={F2={3i+i+ 7 jj −−6k}lbk}lb about the zz axis. Express your answer in pound-inches to three significant figures.arrow_forwardI need you to explain each and every step (Use paper)arrow_forwardCalculate the Moment About the Point A -20"- 5 lb 40 N D 1.5 m 40 N 4.5 m A 15 lb. 150 mm 52 N 5 12 100 mm 15 lb. 26 lb. 12 5 34 lb. 13 8 15 77777 36 lb.arrow_forward
arrow_back_ios
SEE MORE QUESTIONS
arrow_forward_ios
Recommended textbooks for you
 Elements Of ElectromagneticsMechanical EngineeringISBN:9780190698614Author:Sadiku, Matthew N. O.Publisher:Oxford University Press
 Mechanics of Materials (10th Edition)Mechanical EngineeringISBN:9780134319650Author:Russell C. HibbelerPublisher:PEARSON
 Thermodynamics: An Engineering ApproachMechanical EngineeringISBN:9781259822674Author:Yunus A. Cengel Dr., Michael A. BolesPublisher:McGraw-Hill Education
 Control Systems EngineeringMechanical EngineeringISBN:9781118170519Author:Norman S. NisePublisher:WILEY
 Mechanics of Materials (MindTap Course List)Mechanical EngineeringISBN:9781337093347Author:Barry J. Goodno, James M. GerePublisher:Cengage Learning
 Engineering Mechanics: StaticsMechanical EngineeringISBN:9781118807330Author:James L. Meriam, L. G. Kraige, J. N. BoltonPublisher:WILEY

Elements Of Electromagnetics
Mechanical Engineering
ISBN:9780190698614
Author:Sadiku, Matthew N. O.
Publisher:Oxford University Press

Mechanics of Materials (10th Edition)
Mechanical Engineering
ISBN:9780134319650
Author:Russell C. Hibbeler
Publisher:PEARSON

Thermodynamics: An Engineering Approach
Mechanical Engineering
ISBN:9781259822674
Author:Yunus A. Cengel Dr., Michael A. Boles
Publisher:McGraw-Hill Education

Control Systems Engineering
Mechanical Engineering
ISBN:9781118170519
Author:Norman S. Nise
Publisher:WILEY

Mechanics of Materials (MindTap Course List)
Mechanical Engineering
ISBN:9781337093347
Author:Barry J. Goodno, James M. Gere
Publisher:Cengage Learning

Engineering Mechanics: Statics
Mechanical Engineering
ISBN:9781118807330
Author:James L. Meriam, L. G. Kraige, J. N. Bolton
Publisher:WILEY
Heat Transfer – Conduction, Convection and Radiation; Author: NG Science;https://www.youtube.com/watch?v=Me60Ti0E_rY;License: Standard youtube license