
Modern Business Statistics with Microsoft Office Excel (with XLSTAT Education Edition Printed Access Card) (MindTap Course List)
6th Edition
ISBN: 9781337115186
Author: David R. Anderson, Dennis J. Sweeney, Thomas A. Williams, Jeffrey D. Camm, James J. Cochran
Publisher: Cengage Learning
expand_more
expand_more
format_list_bulleted
Concept explainers
Videos
Textbook Question
Chapter 16.6, Problem 24E
The following data show the daily closing prices (in dollars per share) for a stock.

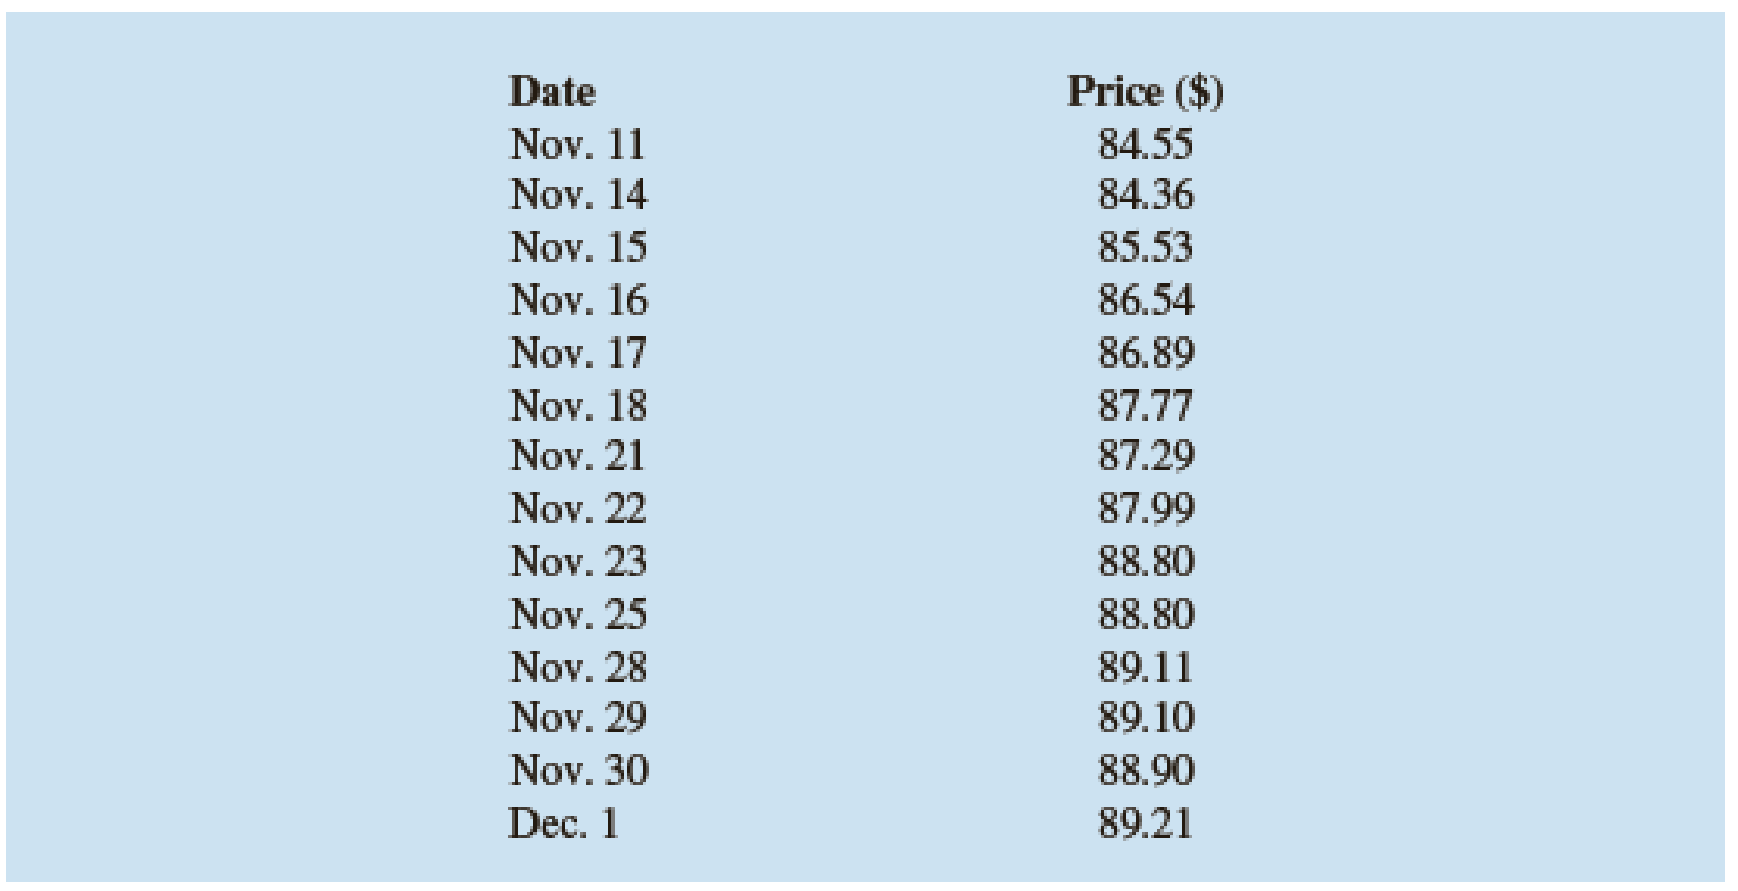
- a. Define the independent variable Period, where Period = 1 corresponds to the data for November 3, Period = 2 corresponds to the data for November 4, and so on. Develop the estimated regression equation that can be used to predict the closing price given the value of Period.
- b. At the .05 level of significance, test for any positive autocorrelation in the data.
Expert Solution & Answer

Trending nowThis is a popular solution!

Students have asked these similar questions
Consider the following regression equation representing the linear relationship between the Canada Child Benefit provided for a married couple with 3 children under the age of 6, based on their annual family net income:
ŷ =121.09−0.57246xR2=0.894
where y = annual Canada Child Benefit paid (in $100s) x = net annual family income (in $1000s)
Source: Canada Revenue Agency
a. As the net annual family income increases, does the Canada Child Benefit paid increase or decrease? Based on this, is the correlation between the two variables positive or negative?The Canada Child Benefit paid
.The correlation between the two variables is
.b. Calculate the correlation coefficient and determine if the relationship between the two variables is strong, moderate or weak.r=
, the relationship is
.
Round to 3 decimal places
c. Interpret the value of the slope as it relates to this relationship.
For every $1 increase in annual family net income, there is a $0.57246 decrease in…
Consider the following regression equation representing the linear relationship between the Canada Child Benefit provided for a married couple with 3 children under the age of 6, based on their annual family net income:
ŷ =121.09−0.57246xR2=0.894
where y= annual Canada Child Benefit paid (in $100s) x = net annual family income (in $1000s)
Source: Canada Revenue Agency
a. As the net annual family income increases, does the Canada Child Benefit paid increase or decrease? Based on this, is the correlation between the two variables positive or negative?The Canada Child Benefit paid ?
.The correlation between the two variables is ?
.b. Calculate the correlation coefficient and determine if the relationship between the two variables is strong, moderate or weak.r=
, the relationship is ?
.
Round to 3 decimal places
c. Interpret the value of the slope as it relates to this relationship.
For every $1 increase in annual family net income, there is a $0.57246 decrease in…
Given below are results from the regression analysis where the dependent variable is the number of weeks a worker is unemployed due to a layoff (Unemploy) and the independent variables are the age of the worker (Age), the number of years of education received (Edu), the number of years at the previous job (Job Yr), a dummy variable for marital status (Married:
1=married,
0=otherwise),
a dummy variable for head of household (Head:
1=yes,
0=no)
and a dummy variable for management position (Manager:
1=yes,
0=no).
We shall call this Model 1. The coefficient of partial determination
(R2Yj.(All variables except j))
of each of the six predictors are, respectively, 0.2807, 0.0386, 0.0317, 0.0141, 0.0958, and 0.1201. Model 2 is the regression analysis where the dependent variable is Unemploy and the independent variables are Age and Manager. The results of the regression analysis are given. Refer to model 1. Which of the following is the correct null hypothesis to test…
Chapter 16 Solutions
Modern Business Statistics with Microsoft Office Excel (with XLSTAT Education Edition Printed Access Card) (MindTap Course List)
Ch. 16.1 - Consider the following data for two variables, x...Ch. 16.1 - Consider the following data for two variables, x...Ch. 16.1 - Prob. 3ECh. 16.1 - A highway department is studying the relationship...Ch. 16.1 - In working further with the problem of exercise 4,...Ch. 16.1 - A study of emergency service facilities...Ch. 16.1 - Home Depot, a nationwide home improvement...Ch. 16.1 - Corvette, Ferrari, and Jaguar produced a variety...Ch. 16.1 - The film Suicide Squad has an average rating of...Ch. 16.2 - In a regression analysis involving 27...
Ch. 16.2 - Prob. 11ECh. 16.2 - The Professional Golfers’ Association of America...Ch. 16.2 - Refer to exercise 12.
Develop an estimated...Ch. 16.2 - A 10-year study conducted by the American Heart...Ch. 16.2 - The average monthly residential gas bill for Black...Ch. 16.5 - Prob. 16ECh. 16.5 - Prob. 17ECh. 16.5 - Prob. 18ECh. 16.5 - Prob. 19ECh. 16.5 - Prob. 20ECh. 16.5 - Prob. 21ECh. 16.5 - Prob. 22ECh. 16.5 - Prob. 23ECh. 16.6 - The following data show the daily closing prices...Ch. 16.6 - Refer to the Cravens data set in Table 16.5. In...Ch. 16 - A sample containing years to maturity and yield...Ch. 16 - Consumer Reports tested 19 different brands and...Ch. 16 - A study investigated the relationship between...Ch. 16 - Refer to the data in exercise 28. Consider a model...Ch. 16 - Refer to the data in exercise 28.
Develop an...Ch. 16 - Prob. 31SECh. 16 - The Ladies Professional Golf Association (LPGA)...Ch. 16 - Wine Spectator magazine contains articles and...
Knowledge Booster


Learn more about
Need a deep-dive on the concept behind this application? Look no further. Learn more about this topic, statistics and related others by exploring similar questions and additional content below.Similar questions
- For the following exercises, use Table 4 which shows the percent of unemployed persons 25 years or older who are college graduates in a particular city, by year. Based on the set of data given in Table 5, calculate the regression line using a calculator or other technology tool, and determine the correlation coefficient. Round to three decimal places of accuracyarrow_forwardFor the following exercises, consider the data in Table 5, which shows the percent of unemployed in a city ofpeople25 years or older who are college graduates is given below, by year. 41. Based on the set of data given in Table 7, calculatethe regression line using a calculator or othertechnology tool, and determine the correlationcoefficient to three decimal places.arrow_forwardFor the following exercises, consider the data in Table 5, which shows the percent of unemployed ina city of people 25 years or older who are college graduates is given below, by year. 40. Based on the set of data given in Table 6, calculate the regression line using a calculator or other technology tool, and determine the correlation coefficient to three decimal places.arrow_forward
- Olympic Pole Vault The graph in Figure 7 indicates that in recent years the winning Olympic men’s pole vault height has fallen below the value predicted by the regression line in Example 2. This might have occurred because when the pole vault was a new event there was much room for improvement in vaulters’ performances, whereas now even the best training can produce only incremental advances. Let’s see whether concentrating on more recent results gives a better predictor of future records. (a) Use the data in Table 2 (page 176) to complete the table of winning pole vault heights shown in the margin. (Note that we are using x=0 to correspond to the year 1972, where this restricted data set begins.) (b) Find the regression line for the data in part ‚(a). (c) Plot the data and the regression line on the same axes. Does the regression line seem to provide a good model for the data? (d) What does the regression line predict as the winning pole vault height for the 2012 Olympics? Compare this predicted value to the actual 2012 winning height of 5.97 m, as described on page 177. Has this new regression line provided a better prediction than the line in Example 2?arrow_forwardFor the following exercises, consider this scenario: The profit of a company decreased steadily overa ten-year spam.The following ordered pairs shows dollars and the number of units sold in hundreds and the profit in thousands ofover the ten-year span, (number of units sold, profit) for specific recorded years: (46,600),(48,550),(50,505),(52,540),(54,495). Use linear regression to determine a function Pwhere the profit in thousands of dollars depends onthe number of units sold in hundreds.arrow_forward2) The following results are an autoregression for US Exports to Mexico where the dependent variable is the lagged value of US Exports. Based on these regression results, what is your forecast of US Exports to Mexico for March 2005?arrow_forward
- The following scatterplot shows a company’s monthly sales, in thousands of dollars, versus monthly advertising dollars spent, in thousands of dollars. Which of the following points is most likely a high-leverage point with respect to a regression of monthly sales versus advertising dollars?arrow_forwardAn investigation into the relationship between an adolescent mother's age x in years and the birth weight y of her baby in grams yielded the regression equation y= - 1163.45 + 245.15x as well as r = .88369, r2= .78091, SSE = 337212.45, and s= 205.30844 1) What is the predicted birth weight for a baby brn to a 17 year old woman? 2) What is the propotion of the variability in the weights of babies born to adolescent mothers that is accounted for by the mother's age? 3) For every additional year in the mother's age that mean birth weight of the baby? (a) increases by about 245g (b) decreases by about 245g (c) increases by about 1163g (d) increases by about 1163g (e) changes by an amount that cannot be determined from the information given.arrow_forwardA sociologist is interested in the relation between ?,the number of job changes and ?, the annual salary(in thousands of dollars) for people living in theNashville area. A random sample of 10 peopleemployed in Nashville provided the followinginformation:? 4 7 5 6 1 5 9 10 10 3? 33 37 34 32 32 38 43 37 40 33 What does the slope of the regression equationrepresent in terms of the annual salary? Identify any outliers or potential influentialobservations. Explain your reasoning. Identify the predictor and response variables. r2 = r= Interpret the meaning of r2 and how useful theregression equation is for making predictions. Please explain what kind of problem this is and how to solve it using a Ti83 calculator. Thank youarrow_forward
- The follow table gives the approximate economic value associated with various levels of oil recovery in Texas. Find the regression line, and use it to estimate the economic value associated with a recovery level of 70%.arrow_forward2. The following data, adapted from Montgomery, Peck, and Vining (2001), present the number of certified mental defectives per 10,000 of estimated population in the United Kingdom ( y) and the number of radio receiver licenses issued (x) by the BBC (in millions) for the years 1924 through 1937. Fit a regression model relating y and x. Comment on the model. Specifically, does the existence of a strong correlation imply a cause-and-effect relationship?arrow_forwardIn order to determine a realistic price for a new product that a company wants to market the company’s research department selected 10 sites thought to have essentially identical sales potential and offered the product in each at a different price. The resulting sales are recorded in the accompanying table: Price ($) Sales ($1,000s) 15.00 15 15.50 14 16.00 16 16.50 9 17.00 12 17.50 10 18.00 8 18.50 9 19.00 6 19.50 5 h). Estimate the slope of the actual equation of the regression line using a 95% confidence interval and interpret this interval.arrow_forward
arrow_back_ios
SEE MORE QUESTIONS
arrow_forward_ios
Recommended textbooks for you

 Functions and Change: A Modeling Approach to Coll...AlgebraISBN:9781337111348Author:Bruce Crauder, Benny Evans, Alan NoellPublisher:Cengage Learning
 College AlgebraAlgebraISBN:9781305115545Author:James Stewart, Lothar Redlin, Saleem WatsonPublisher:Cengage Learning
 Glencoe Algebra 1, Student Edition, 9780079039897...AlgebraISBN:9780079039897Author:CarterPublisher:McGraw Hill
 Algebra and Trigonometry (MindTap Course List)AlgebraISBN:9781305071742Author:James Stewart, Lothar Redlin, Saleem WatsonPublisher:Cengage Learning
Functions and Change: A Modeling Approach to Coll...
Algebra
ISBN:9781337111348
Author:Bruce Crauder, Benny Evans, Alan Noell
Publisher:Cengage Learning
College Algebra
Algebra
ISBN:9781305115545
Author:James Stewart, Lothar Redlin, Saleem Watson
Publisher:Cengage Learning
Glencoe Algebra 1, Student Edition, 9780079039897...
Algebra
ISBN:9780079039897
Author:Carter
Publisher:McGraw Hill
Algebra and Trigonometry (MindTap Course List)
Algebra
ISBN:9781305071742
Author:James Stewart, Lothar Redlin, Saleem Watson
Publisher:Cengage Learning
Correlation Vs Regression: Difference Between them with definition & Comparison Chart; Author: Key Differences;https://www.youtube.com/watch?v=Ou2QGSJVd0U;License: Standard YouTube License, CC-BY
Correlation and Regression: Concepts with Illustrative examples; Author: LEARN & APPLY : Lean and Six Sigma;https://www.youtube.com/watch?v=xTpHD5WLuoA;License: Standard YouTube License, CC-BY