
Concept explainers
Videos
Refer to Exercise 14.36.
- a. Are the computational formulas for obtaining the sum of squares appropriate for the data in the tomato experiment? Justify your answer.
- b. Verify that there are no major violations in the conditions necessary to conduct the F tests in the AOV table.
- c. Write a linear model for this experiment, and estimate all the terms in your model using the data in Exercise 14.36.
14.36 A horticulturalist at a large research institution designs a study to evaluate the effect on tomato yields of water loss due to transpiration. She decides to examine four levels of shading of the tomato plants at three stages of the tomato plant’s development. The four levels of shading (0, 25%, 50%, and 75%) were selected to reduce the solar exposure of the plants. The shading remained in place for 20 days during the early, middle, and late phases of the tomato plants’ growth. There were four plots of tomatoes randomly assigned to each of the combinations of shading and growth stage. At the end of the study, the yields per plot in pounds were recorded. However, due to a problem in the harvesting of the tomatoes, a few of the plot yields were not recorded.
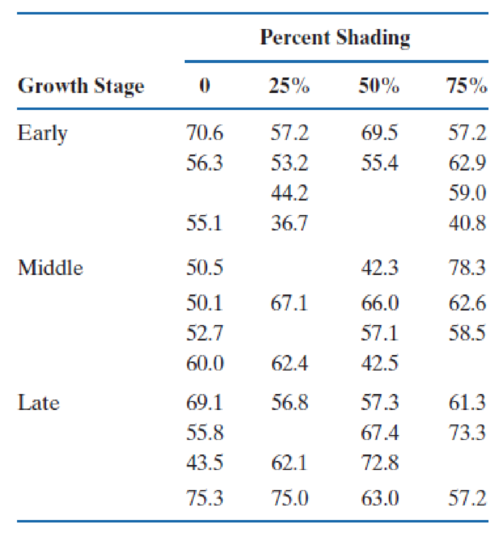
- a. Identify the design for this experiment.
- b. Construct an AOV table for the experiment, and test for the main effects of shading and growth stage and an interaction between shading and growth stage.
- c. Is there a linear trend in the mean yields across the levels of percent shading?
- d. Which level of shading would you recommend for maximum yield?
- e. During which growth stage would you apply the shading?
Want to see the full answer?
Check out a sample textbook solution
Chapter 14 Solutions
An Introduction to Statistical Methods and Data Analysis


 Linear Algebra: A Modern IntroductionAlgebraISBN:9781285463247Author:David PoolePublisher:Cengage Learning
 Calculus For The Life SciencesCalculusISBN:9780321964038Author:GREENWELL, Raymond N., RITCHEY, Nathan P., Lial, Margaret L.Publisher:Pearson Addison Wesley,
 Algebra & Trigonometry with Analytic GeometryAlgebraISBN:9781133382119Author:SwokowskiPublisher:Cengage
 Big Ideas Math A Bridge To Success Algebra 1: Stu...AlgebraISBN:9781680331141Author:HOUGHTON MIFFLIN HARCOURTPublisher:Houghton Mifflin Harcourt
 Glencoe Algebra 1, Student Edition, 9780079039897...AlgebraISBN:9780079039897Author:CarterPublisher:McGraw Hill