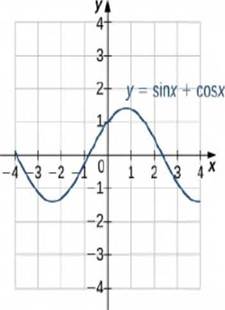
Consider the graph in Figure 1.42 of the function

Figure 1.42 The graph of
Using a graphing calculator or other graphing device, estimate the x - and y -values of the maximum point for the graph (the first such point where x >0). It may be helpful to express the x -value as a multiple of
Trending nowThis is a popular solution!

Chapter 1 Solutions
Calculus Volume 1
Additional Math Textbook Solutions
Elementary Statistics: Picturing the World (7th Edition)
Calculus: Early Transcendentals (2nd Edition)
Elementary and Intermediate Algebra: Concepts and Applications (7th Edition)
Elementary Statistics (13th Edition)
Intro Stats, Books a la Carte Edition (5th Edition)
Thinking Mathematically (6th Edition)
- Let f be defined as follows. y = f(x) = x² - 5x (a) Find the average rate of change of y with respect to x in the following intervals. from x = 4 to x = 5 from x = 4 to x = 4.5 from x = 4 to x = 4.1 (b) Find the (instantaneous) rate of change of y at x = 4. Need Help? Read It Master Itarrow_forwardDetermine whether the inverse of f(x)=x^4+2 is a function. Then, find the inverse.arrow_forwardVelocity of a Ball Thrown into the Air The position function of an object moving along a straight line is given by s = f(t). The average velocity of the object over the time interval [a, b] is the average rate of change of f over [a, b]; its (instantaneous) velocity at t = a is the rate of change of f at a. A ball is thrown straight up with an initial velocity of 128 ft/sec, so that its height (in feet) after t sec is given by s = f(t) = 128t - 16t². (a) What is the average velocity of the ball over the following time intervals? [3,4] [3, 3.5] [3, 3.1] ft/sec ft/sec ft/sec (b) What is the instantaneous velocity at time t = 3? ft/sec (c) What is the instantaneous velocity at time t = 7? ft/sec Is the ball rising or falling at this time? O rising falling (d) When will the ball hit the ground? t = sec Need Help? Read It Watch Itarrow_forward
- Find the slope of the tangent line to the graph of the function at the given point. f(x) = -4x + 5 at (-1, 9) m Determine an equation of the tangent line. y = Need Help? Read It Watch It SUBMIT ANSWERarrow_forwardFind the slope of the tangent line to the graph of the function at the given point. f(x) = 5x-4x² at (-1, -9) m Determine an equation of the tangent line. y = Need Help? Read It Master It SUBMIT ANSWERarrow_forwardy = log 5 – x2 - 4 00arrow_forward
- For what value of A and B the function f(x) will be continuous everywhere for the given definition?..arrow_forwardPlease fill in the rest of the steps of the proof of Thm 2.5. Show how "Repeating this step with n-1,n-2,...,2 in place of n" gives us the desired result.arrow_forward2. [-/1 Points] DETAILS MY NOTES SESSCALCET2 6.4.006.MI. Use the Table of Integrals to evaluate the integral. (Remember to use absolute values where appropriate. Use C for the constant of integration.) 7y2 y² 11 dy Need Help? Read It Master It SUBMIT ANSWER 3. [-/1 Points] DETAILS MY NOTES SESSCALCET2 6.4.009. Use the Table of Integrals to evaluate the integral. (Remember to use absolute values where appropriate. Use C for the constant of integration.) tan³(12/z) dz Need Help? Read It Watch It SUBMIT ANSWER 4. [-/1 Points] DETAILS MY NOTES SESSCALCET2 6.4.014. Use the Table of Integrals to evaluate the integral. (Use C for the constant of integration.) 5 sinб12x dx Need Help? Read Itarrow_forward
 College Algebra (MindTap Course List)AlgebraISBN:9781305652231Author:R. David Gustafson, Jeff HughesPublisher:Cengage LearningAlgebra & Trigonometry with Analytic GeometryAlgebraISBN:9781133382119Author:SwokowskiPublisher:Cengage
 Trigonometry (MindTap Course List)TrigonometryISBN:9781337278461Author:Ron LarsonPublisher:Cengage Learning
 Mathematics For Machine TechnologyAdvanced MathISBN:9781337798310Author:Peterson, John.Publisher:Cengage Learning,
 Trigonometry (MindTap Course List)TrigonometryISBN:9781305652224Author:Charles P. McKeague, Mark D. TurnerPublisher:Cengage Learning


