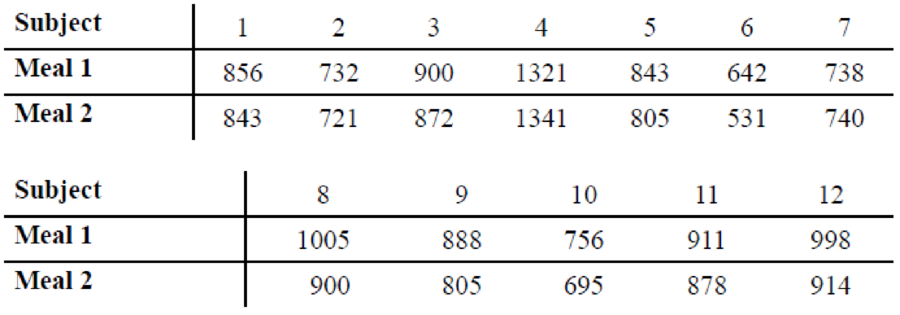
Effects of a Pill on Appetite A researcher wishes to test the effects of a pill on a person’s appetite. Twelve randomly selected subjects are allowed to eat a meal of their choice, and their caloric intake is measured. The next day, the same subjects take the pill and eat a meal of their choice. The caloric intake of the second meal is measured. The data are shown here. At α = 0.02, can the researcher conclude that the pill had an effect on a person’s appetite?

Want to see the full answer?
Check out a sample textbook solution
Chapter 13 Solutions
Elementary Statistics: A Step By Step Approach
Additional Math Textbook Solutions
A First Course in Probability (10th Edition)
APPLIED STAT.IN BUS.+ECONOMICS
Introductory Statistics
Mathematics for the Trades: A Guided Approach (11th Edition) (What's New in Trade Math)
Elementary Statistics ( 3rd International Edition ) Isbn:9781260092561
Elementary Statistics: Picturing the World (7th Edition)
- Think about which Cohen’s d formula to use: one sample, paired sample, or independent sample. Calculate an effect size for the data. Hoaglin, Mosteller, and Tukey (1983) present data on blood levels of beta-endorphin as a function of stress. They took beta-endorphin levels for 19 patients 12 hours before surgery, and again 10 minutes before surgery. The data are presented below, in fmol/ml: 12 hours 10 6.5 8 12 5 11.5 5 3.5 7.5 5.8 4.7 8 7 17 8.8 17 15 4.4 2 10 minutes 6.5 14 13.5 18 14.5 9 18 42 7.5 6 25 12 52 20 16 15 11.5 2.5 2arrow_forwardDecide whether to reject or fail to reject the null hypothesis. Choose the correct answer below.arrow_forwardDecide whether to reject or fail to reject the null hypothesis. Choose the correct answer below.arrow_forward
- Find the score that 75% of students will exceed. Consider the NAEP scores which are approximately normal N(288,38). 75% of the students will score above x on this exam. Find x.arrow_forwardRandom collections of nine different solutions of a calcium compound were given to two laboratories, A and B. Each laboratory measured the calcium content (in mmol per liter) and reported the results. The data are paired by calcium compound. Compound 1 2 3 4 5 6 7 8 9 Lab A (x) 15.36 12.83 8.81 11.30 13.59 9.66 10.72 14.05 11.54 Lab B (y) 15.17 12.72 8.69 11.45 13.63 9.63 10.75 14.23 11.55 (a) Rank-order the data using 1 for the lowest calcium reading. Make a table of ranks to be used in a Spearman rank correlation test. (b) Compute the sample test statistic. (Round your answer to three decimal places.)arrow_forwardRandom collections of nine different solutions of a calcium compound were given to two laboratories, A and B. Each laboratory measured the calcium content (in mmol per liter) and reported the results. The data are paired by calcium compound. Compound 1 2 3 4 5 6 7 8 9 Lab A (x) 12.35 9.83 10.79 11.31 8.58 13.69 14.68 15.07 11.57 Lab B (y) 12.18 9.72 10.70 11.51 8.63 13.58 14.71 15.24 11.57 (a) Rank-order the data using 1 for the lowest calcium reading. Make a table of ranks to be used in a Spearman rank correlation test. Compound Lab A (x) Lab B (y) d = x − y d2 1 2 3 4 5 6 7 8 9 Σd2 = (b) Use a 5% level of significance to test for a monotone relation (either way) between ranks. Interpret the results. What is the level of significance? Compute the sample test statistic. (Round your answer to three decimal places.)arrow_forward
- Tourism is extremely important to the economy of Florida. Hotel occupancy is an often-reported measure of visitor volume and visitor activity (Orlando Sentinel, May 19, 2018). Hotel occupancy data for February in two consecutive years are as follows. Current Year 1,512 1,800 Let P₁= population proportion of rooms occupied for current year P2 = population proportion of rooms occupied for previous year Occupied Rooms Total Rooms 1,458 1,800 a. Formulate the hypothesis test that can be used to determine whether there has been an increase in the proportion of rooms occupied over the one-year period. Previous Year Ho: P1 P2 - Select your answer - Ha P₁ P2 - Select your answer b. What is the estimated proportion of hotel rooms occupied each year (to 2 decimals)? Current year Previous Year c. Conduct a hypothesis test. What is the p-value (to 4 decimals)? Use Table 1 from Appendix B. p-value = Using a 0.05 level of significance, what is your conclusion? We-Select your answer that there has…arrow_forwardJOB x LIFE SATISF, PART 2 of 6. What is your critical F score value for these scores at α = 0.05? A researcher is interested in the effect of employment on life satisfaction. He selects a random sample of 12 adults who are employed full time, employed part time, temporarily unemployed, or chronically unemployed. He provided a scale that assessed their life satisfaction on a scale that ranges from 0 (very dissatisfied) to 80 (very satisfied). His results are as follows: What is your critical F score value for these scores at α = 0.05?arrow_forwardOne doctor claims that a person's diastolic blood pressure can be lowered if, instead of taking medicine, the person listens to a relaxation tape every night. Ten subjects are selected at random. Your blood pressure, measured in millimeters of mercury, is listed below. All 10 patients are given the tapes and asked to listen to them every night for a month. At the end of the month, their blood pressure is taken again. The data is listed below. Use alpha equals 0.05 to test the doctor's claim.arrow_forward
- An experiment was conducted to see the effectiveness of two antidotes to three different doses of a toxin. The antidote was given to a different sample of participants five minutes after the toxin. Thirty minutes later the response was measured as the concentration in the blood. What can the researchers conclude with α = 0.05? Dose Antidote 5 10 15 1 0.61.11.1 7.21.52.4 3.14.15.9 2 1.11.21.1 1.71.31.5 2.13.12.1 A) Obtain/compute the appropriate values to make a decision about H0.Antidote: critical value = test statistic = Decision: Dose: critical value = test statistic = Decision: Interaction: critical value = test statistic = Decision: B) Compute the corresponding effect size(s) and indicate magnitude(s).Antidote: η2 = Dose: η2 = Interaction: η2 =arrow_forwardYou have been hired to measure the concentration of ammonia in water from wells at two districts on Long Island. After sampling 10 wells in one of the districts you find the values are, in mg/L: 6.4, 2.1, 1.4, 0.7, 6.8, 3.2, 2.7, 1.6, 4.9, 1.2. Your assistant plots the data from the second set of wells and the histogram of data from that sample looks pretty much the same as for your data set. Which statistical test do you anticipate that you will use? An one-sample t-test An unpaired, two-sample t-test A paired, two-sample t-test A one-way anova A Mann-Whitney U test Main Contentarrow_forwardIf X = 85, Y = 54, and Y' = 62, what is the residual score? a. -8 b. 23 c. 8 d. 31arrow_forward
 Glencoe Algebra 1, Student Edition, 9780079039897...AlgebraISBN:9780079039897Author:CarterPublisher:McGraw Hill
 Linear Algebra: A Modern IntroductionAlgebraISBN:9781285463247Author:David PoolePublisher:Cengage Learning

