
APPLIED STAT.IN BUS.+ECONOMICS
6th Edition
ISBN: 9781259957598
Author: DOANE
Publisher: RENT MCG
expand_more
expand_more
format_list_bulleted
Concept explainers
Videos
Textbook Question
Chapter 13.1, Problem 1SE
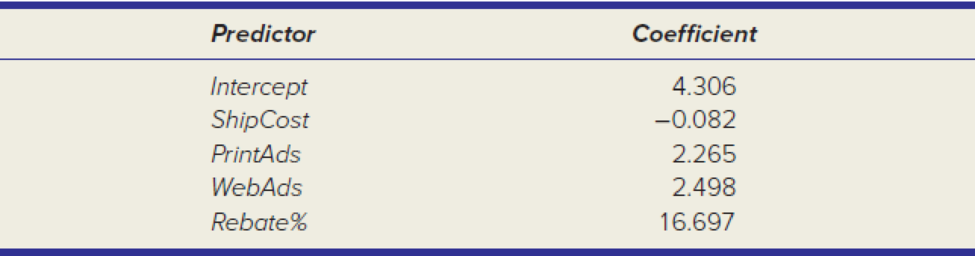
Observations are taken on net revenue from sales of a certain LCD TV at 50 retail outlets. The regression model was Y = net revenue (thousands of dollars), X1 = shipping cost (dollars per unit), X2 = expenditures on print advertising (thousands of dollars), X3 = expenditure on electronic media ads (thousands), X4 = rebate rate (percent of retail price). (a) Write the fitted regression equation. (b) Interpret each coefficient. (c) Would the intercept be likely to have meaning in this regression? (d) Use the fitted equation to make a prediction for NetRevenue when ShipCost = 10, PrintAds = 50, WebAds = 40, and Rebate% = 15.
Expert Solution & Answer
Want to see the full answer?
Check out a sample textbook solution
Chapter 13 Solutions
APPLIED STAT.IN BUS.+ECONOMICS
Ch. 13.1 - Observations are taken on net revenue from sales...Ch. 13.1 - Observations are taken on sales of a certain...Ch. 13.1 - Prob. 3SECh. 13.1 - A regression model to predict Y, the...Ch. 13.2 - Refer to the ANOVA table below. (a) State the...Ch. 13.2 - Refer to the ANOVA table below. (a) State the...Ch. 13.2 - Prob. 7SECh. 13.2 - Refer to the ANOVA table below. (a) State the...Ch. 13.3 - Observations are taken on net revenue from sales...Ch. 13.3 - Observations are taken on sales of a certain...
Ch. 13.3 - Prob. 11SECh. 13.3 - A regression model to predict Y, the state...Ch. 13.4 - A regression of accountants starting salaries in a...Ch. 13.4 - An agribusiness performed a regression of wheat...Ch. 13.5 - Prob. 15SECh. 13.5 - A regression model to predict the price of...Ch. 13.5 - Prob. 17SECh. 13.5 - Prob. 18SECh. 13.6 - Prob. 19SECh. 13.6 - Prob. 20SECh. 13.7 - Prob. 21SECh. 13.7 - Using the Metals data, construct a correlation...Ch. 13.8 - Prob. 23SECh. 13.8 - Which violations of regression assumptions, if...Ch. 13 - (a) List two limitations of simple regression. (b)...Ch. 13 - (a) What does represent in the regression model?...Ch. 13 - Prob. 3CRCh. 13 - Prob. 4CRCh. 13 - Prob. 5CRCh. 13 - Prob. 6CRCh. 13 - Prob. 7CRCh. 13 - Prob. 8CRCh. 13 - Prob. 9CRCh. 13 - (a) State the formula for the standard error of...Ch. 13 - (a) What is a binary predictor? (b) Why is a...Ch. 13 - Prob. 12CRCh. 13 - Prob. 13CRCh. 13 - (a) What is multicollinearity? (b) What are its...Ch. 13 - Prob. 15CRCh. 13 - (a) State the formula for a variance inflation...Ch. 13 - Prob. 17CRCh. 13 - Prob. 18CRCh. 13 - Prob. 19CRCh. 13 - Prob. 20CRCh. 13 - (a) Name two ways to detect autocorrelated...Ch. 13 - (a) What is a lurking variable? How might it be...Ch. 13 - Prob. 23CRCh. 13 - Instructions for Data Sets: Choose one of the data...Ch. 13 - Note: Exercises marked are based on optional...Ch. 13 - Prob. 27CECh. 13 - Note: Exercises marked are based on optional...Ch. 13 - Note: Exercises marked are based on optional...Ch. 13 - Prob. 30CECh. 13 - Prob. 31CECh. 13 - Prob. 32CECh. 13 - Prob. 33CECh. 13 - Prob. 34CECh. 13 - Prob. 35CECh. 13 - Note: Exercises marked are based on optional...Ch. 13 - Note: Exercises marked are based on optional...Ch. 13 - Note: Exercises marked are based on optional...Ch. 13 - Prob. 39CECh. 13 - Prob. 40CECh. 13 - Prob. 41CECh. 13 - In a model of Fords quarterly revenue TotalRevenue...Ch. 13 - In a study of paint peel problems, a regression...Ch. 13 - A hospital emergency room analyzed n = 17,664...Ch. 13 - Prob. 45CECh. 13 - A researcher used stepwise regression to create...Ch. 13 - A sports enthusiast created an equation to predict...Ch. 13 - An expert witness in a case of alleged racial...Ch. 13 - Prob. 50CECh. 13 - Prob. 51CECh. 13 - Prob. 52CECh. 13 - Which statement is correct concerning one-factor...Ch. 13 - Prob. 2ERQCh. 13 - Prob. 3ERQCh. 13 - Prob. 4ERQCh. 13 - Prob. 5ERQCh. 13 - Prob. 6ERQCh. 13 - Prob. 7ERQCh. 13 - Prob. 8ERQCh. 13 - Prob. 9ERQCh. 13 - Prob. 10ERQCh. 13 - Prob. 11ERQCh. 13 - Prob. 12ERQCh. 13 - Prob. 13ERQCh. 13 - Prob. 14ERQCh. 13 - Prob. 15ERQ
Knowledge Booster


Learn more about
Need a deep-dive on the concept behind this application? Look no further. Learn more about this topic, statistics and related others by exploring similar questions and additional content below.Similar questions
- Find the equation of the regression line for the following data set. x 1 2 3 y 0 3 4arrow_forwardOlympic Pole Vault The graph in Figure 7 indicates that in recent years the winning Olympic men’s pole vault height has fallen below the value predicted by the regression line in Example 2. This might have occurred because when the pole vault was a new event there was much room for improvement in vaulters’ performances, whereas now even the best training can produce only incremental advances. Let’s see whether concentrating on more recent results gives a better predictor of future records. (a) Use the data in Table 2 (page 176) to complete the table of winning pole vault heights shown in the margin. (Note that we are using x=0 to correspond to the year 1972, where this restricted data set begins.) (b) Find the regression line for the data in part ‚(a). (c) Plot the data and the regression line on the same axes. Does the regression line seem to provide a good model for the data? (d) What does the regression line predict as the winning pole vault height for the 2012 Olympics? Compare this predicted value to the actual 2012 winning height of 5.97 m, as described on page 177. Has this new regression line provided a better prediction than the line in Example 2?arrow_forwardFor the following exercises, use Table 4 which shows the percent of unemployed persons 25 years or older who are college graduates in a particular city, by year. Based on the set of data given in Table 5, calculate the regression line using a calculator or other technology tool, and determine the correlation coefficient. Round to three decimal places of accuracyarrow_forward
arrow_back_ios
arrow_forward_ios
Recommended textbooks for you

 College AlgebraAlgebraISBN:9781305115545Author:James Stewart, Lothar Redlin, Saleem WatsonPublisher:Cengage Learning
 Functions and Change: A Modeling Approach to Coll...AlgebraISBN:9781337111348Author:Bruce Crauder, Benny Evans, Alan NoellPublisher:Cengage Learning
 Glencoe Algebra 1, Student Edition, 9780079039897...AlgebraISBN:9780079039897Author:CarterPublisher:McGraw Hill
 Algebra & Trigonometry with Analytic GeometryAlgebraISBN:9781133382119Author:SwokowskiPublisher:Cengage
 Algebra and Trigonometry (MindTap Course List)AlgebraISBN:9781305071742Author:James Stewart, Lothar Redlin, Saleem WatsonPublisher:Cengage Learning
College Algebra
Algebra
ISBN:9781305115545
Author:James Stewart, Lothar Redlin, Saleem Watson
Publisher:Cengage Learning
Functions and Change: A Modeling Approach to Coll...
Algebra
ISBN:9781337111348
Author:Bruce Crauder, Benny Evans, Alan Noell
Publisher:Cengage Learning
Glencoe Algebra 1, Student Edition, 9780079039897...
Algebra
ISBN:9780079039897
Author:Carter
Publisher:McGraw Hill
Algebra & Trigonometry with Analytic Geometry
Algebra
ISBN:9781133382119
Author:Swokowski
Publisher:Cengage
Algebra and Trigonometry (MindTap Course List)
Algebra
ISBN:9781305071742
Author:James Stewart, Lothar Redlin, Saleem Watson
Publisher:Cengage Learning
Correlation Vs Regression: Difference Between them with definition & Comparison Chart; Author: Key Differences;https://www.youtube.com/watch?v=Ou2QGSJVd0U;License: Standard YouTube License, CC-BY
Correlation and Regression: Concepts with Illustrative examples; Author: LEARN & APPLY : Lean and Six Sigma;https://www.youtube.com/watch?v=xTpHD5WLuoA;License: Standard YouTube License, CC-BY