
Concept explainers
Videos
Salary after College. In 2010, Monster College surveyed 1250 U.S. college students expecting to graduate in the next several years. Respondents were asked the following question:
What do you think your starting salary will be at your first job after college?
The line graph shows the percentage of college students who anticipated various starting salaries. Use the graph to solve Exercises 9–
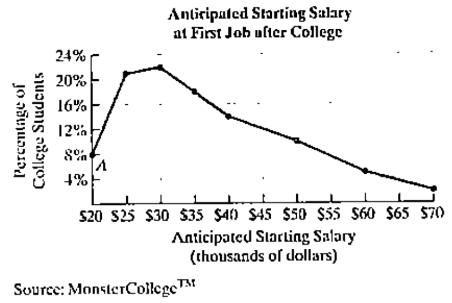
The mathematics model
describes the percentage of college students p. who anticipated a starting salary s. in thousands dollars. Use this formula to find the percentage of student who anticipated a starting salary of $40 thousand. How does this compare with your estimate in Exercises 13?
Want to see the full answer?
Check out a sample textbook solution
Chapter 1 Solutions
COLLEGE ALGEBRA-MYMATHLAB


- Use this data for the exercises that follow: In 2013, there were roughly 317 million citizens in the United States, and about 40 million were elderly (aged 65 and over).[34] 56. If you meet a U.S. citizen, what is the percent chance that the person is elderly? (Round to the nearest tenth of a percent.)arrow_forwardU.S. Census data shows that the median price of new home in the United States in November 2014 was $280,900. This was $10,700 more than 14 times the price in November 1964. What was the median price of a new home in November 1964?arrow_forwardUse this data for the exercises that follow: In 2013, there were roughly 317 million citizens in the United States, and about 40 million were elderly (aged 65 and over).[34] 58. If you meet five U.S. citizens, what is the percent chance that three are elderly? (Round to the nearest tenth of a percent)arrow_forward
- Use this data for the exercises that follow: In 2013, there were roughly 317 million citizens in the United States, and about 40 million were elderly (aged 65 and over).[34] 57. If you meet five U.S. citizens, what is the percent chance that exactly one is elderly? (Round to the nearest tenth of a percent.)arrow_forwardSolve using R. Show all work.arrow_forwardSvheherhhrjrjrjtjtktktktktktkykyarrow_forward
- What is the height of this graph? There’s one rectangle missing. This graph represents silver in parts per million.arrow_forwardSolve the problem. 50 people are selected randomly from a certain population and it is found that 13 people in the sample are over 6 feet tall. What is a point estimate of the proportion of people in the population who are over 6 feet tall?arrow_forwardA production process produces an item. On average, 16% of all items produced are defective. Each item is inspected before being shipped, and the inspector misclassifies an item 5% of the time. Please round the final answers to 3 decimal places. What proportion of the items will be "classified as good"? P(classified as good)=arrow_forward

 Elementary AlgebraAlgebraISBN:9780998625713Author:Lynn Marecek, MaryAnne Anthony-SmithPublisher:OpenStax - Rice University
 Holt Mcdougal Larson Pre-algebra: Student Edition...AlgebraISBN:9780547587776Author:HOLT MCDOUGALPublisher:HOLT MCDOUGAL
 Glencoe Algebra 1, Student Edition, 9780079039897...AlgebraISBN:9780079039897Author:CarterPublisher:McGraw Hill
 Big Ideas Math A Bridge To Success Algebra 1: Stu...AlgebraISBN:9781680331141Author:HOUGHTON MIFFLIN HARCOURTPublisher:Houghton Mifflin Harcourt