
MATLAB: An Introduction with Applications
6th Edition
ISBN: 9781119256830
Author: Amos Gilat
Publisher: John Wiley & Sons Inc
expand_more
expand_more
format_list_bulleted
Related questions
Question
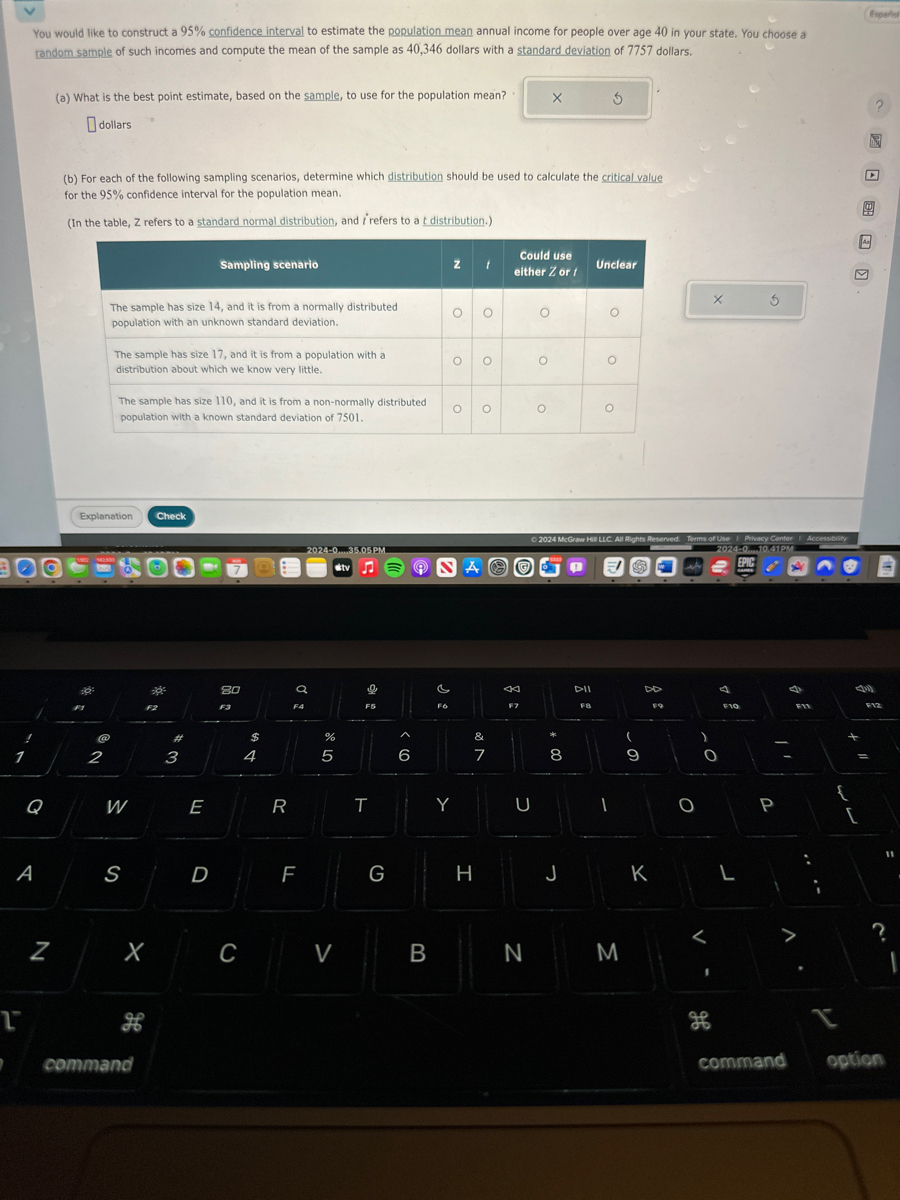

Transcribed Image Text:You would like to construct a 95% confidence interval to estimate the population mean annual income for people over age 40 in your state. You choose a
random sample of such incomes and compute the mean of the sample as 40,346 dollars with a standard deviation of 7757 dollars.
(a) What is the best point estimate, based on the sample, to use for the population mean?
dollars
G
(b) For each of the following sampling scenarios, determine which distribution should be used to calculate the critical value
for the 95% confidence interval for the population mean.
(In the table, Z refers to a standard normal distribution, and refers to a t distribution.)
Sampling scenario
z
t
Could use
either Z or /
Unclear
The sample has size 14, and it is from a normally distributed
population with an unknown standard deviation.
о
о
The sample has size 17, and it is from a population with a
distribution about which we know very little.
O
о
The sample has size 110, and it is from a non-normally distributed
population with a known standard deviation of 7501.
о
о
O
Explanation
Check
Q
0.
A
N
2
W
S
#3
X
T
H
command
80
F3
$
4
5
Experi
©2024 McGraw Hill LLC. All Rights Reserved. Terms of Use Privacy Center
Accessibility
2024-035.05PM
tv
NAC
2024-0.10.41PM
EPIC
5 de
%
S
E
R
T
D
C
F
>
< 6
&
7
81
U
8
D-11
F8
A
F10
9
0
P
{
F12
G
H
J
K
L
?
B
N
M
He
command
option
Expert Solution
This question has been solved!
Explore an expertly crafted, step-by-step solution for a thorough understanding of key concepts.

Step by stepSolved in 2 steps

Knowledge Booster

Similar questions
- Suppose you take a random sample of n = 80 Douglas College students and ask each student their age. You find that the mean age of students in this sample is X = 22.0375 years and the sample standard deviation is s = 3.2014 years. Fill in the blanks (rounding to four decimal places): The 95% confidence interval for the mean age μ of all Douglas College students is from ______ years to ______ years.arrow_forwardA study on the latest fad diet claimed that the amounts of weight lost by all people on this diet had a mean of 21.2 pounds and a standard deviation of 4.6 pounds. Step 1 of 2 : If a sampling distribution is created using samples of the amounts of weight lost by 85 people on this diet, what would be the mean of the sampling distribution of sample means? Round to two decimal places, if necessary.arrow_forwardYou would like to construct a 99% Confidence interval to estimate the population mean price of milk (per gallon) in your city. You select a random sample of prices from different stores. The sample has a mean of 3.74 dollars and a standard deviation of 0.25 dollars. (a) What is the best point estimate, based on the sample, to use for the population mean? Aa O dollars (b) For each of the following sampling scenarios, determine which distribution should be used to calculate the critical value for the 99% confidence interval for the population mean. (In the table, z refers to a standard normal distribution, and i refers to a t distribution.) Could use Sampling scenario Unclear either Z or t ? The sample has size 105, and it is from a non-normally distributed population with a known standard deviation of 0.24. The sample has size 90, and it is from a non-normally distributed population. The sample has size 20, and it is from a normally distributed population with an unknown standard…arrow_forward
- In a normal distribution of scores, four participants obtained the following deviation scores: +1, −2, +5, and −10. (a) Which score reflects the highest raw score? (b) Which score reflects the lowest raw score? (c) Rank-order the deviation scores in terms of their frequency, starting with the score with the lowest frequency.arrow_forwardA successful basketball player has a height of 6 feet 11 inches, or 211 cm. Based on statistics from a data set, his height converts to the z score of 5.17. How many standard deviations is his height above the mean?arrow_forwardYou would like to construct a 95% confidence interval to estimate the population mean score on a nationwide examination in psychology, and for this purpose we choose a random sample of exam scores. The sample we choose has a mean of 511 and a standard deviation of 71. (a) What is the best point estimate, based on the sample, to use for the population mean? X ? (b) For each of the following sampling scenarios, determine which distribution should be used to calculate the critical value for the 95% confidence interval for the population mean. (In the table, Z refers to a standard normal distribution, and t refers to a t distribution.)arrow_forward
arrow_back_ios
arrow_forward_ios
Recommended textbooks for you
- MATLAB: An Introduction with ApplicationsStatisticsISBN:9781119256830Author:Amos GilatPublisher:John Wiley & Sons Inc
 Probability and Statistics for Engineering and th...StatisticsISBN:9781305251809Author:Jay L. DevorePublisher:Cengage Learning
 Statistics for The Behavioral Sciences (MindTap C...StatisticsISBN:9781305504912Author:Frederick J Gravetter, Larry B. WallnauPublisher:Cengage Learning
  Elementary Statistics: Picturing the World (7th E...StatisticsISBN:9780134683416Author:Ron Larson, Betsy FarberPublisher:PEARSON
 The Basic Practice of StatisticsStatisticsISBN:9781319042578Author:David S. Moore, William I. Notz, Michael A. FlignerPublisher:W. H. Freeman
 Introduction to the Practice of StatisticsStatisticsISBN:9781319013387Author:David S. Moore, George P. McCabe, Bruce A. CraigPublisher:W. H. Freeman
MATLAB: An Introduction with Applications
Statistics
ISBN:9781119256830
Author:Amos Gilat
Publisher:John Wiley & Sons Inc
Probability and Statistics for Engineering and th...
Statistics
ISBN:9781305251809
Author:Jay L. Devore
Publisher:Cengage Learning
Statistics for The Behavioral Sciences (MindTap C...
Statistics
ISBN:9781305504912
Author:Frederick J Gravetter, Larry B. Wallnau
Publisher:Cengage Learning
Elementary Statistics: Picturing the World (7th E...
Statistics
ISBN:9780134683416
Author:Ron Larson, Betsy Farber
Publisher:PEARSON
The Basic Practice of Statistics
Statistics
ISBN:9781319042578
Author:David S. Moore, William I. Notz, Michael A. Fligner
Publisher:W. H. Freeman
Introduction to the Practice of Statistics
Statistics
ISBN:9781319013387
Author:David S. Moore, George P. McCabe, Bruce A. Craig
Publisher:W. H. Freeman