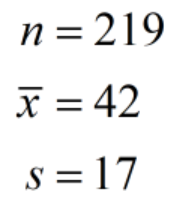
You work for a charitable organization and you want to see whether the people who donate to your organization have an average age above 40 years. You get a random sample of 219 donors and the value of the sample mean age is 42 years. The value of the sample standard deviation is 17 years. The executive director wants you to be 95% confident in your results.
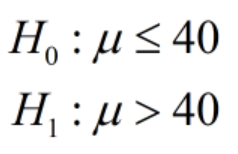
- State in statistical terms the null and alternative hypotheses.
- Determine the critical value(s).
- Compute the test statistic.
- Make a decision about the hypotheses (which hypothesis is correct?)
- Are donors older than 40 years old?
I need help with #2, 3, and 4. Though I worked 2, I'm still confused about it.
I got 1.7410 for 3
And 1.7410>1.6519 for 4.
I am not sure if I'm right. Help!
State the given values.

1)
State the null and alternate hypothesis.

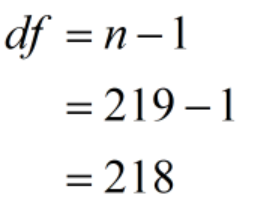
Calculate the degree of freedom.

2)
Calculate the t critical value using t table at 95% confidence level where the degree of freedom = 218.

Step by stepSolved in 4 steps with 6 images

- One personality test available on the World Wide Web has a subsection designed to assess the "honesty" of the test-taker. After taking the test and seeing your score for this subsection, you're interested in the mean score, µ, among the general population on this subsection. The website reports that µ is 142, but you believe that u is less than 142. You decide to do a statistical test. You choose a random sample of people and have them take the personality test. You find that their mean score on the subsection is 135 and that the standard deviation of their scores is 28. Based on this information, answer the questions below. What are the null hypothesis (H) and the alternative hypothesis (H,) that should be used for the test? Ho: u is ? ? |H,: µ is ? H : ? In the context of this test, what is a Type II error? A Type II error is ? v the hypothesis that u is ? v when, in fact, μ is| ? ? Suppose that you decide not to reject the null hypothesis. What sort of error might you be making? ?arrow_forwardLucille, Rocio, and Cristina are all taking College Mathematics but from different professors. They all recently took a statistics exam and the exam scores were normally distributed in each of their classes. • Lucille's class had an average grade of 78 and the standard deviation was 7. Lucille earned 83.95 on the exam. • Rocio's class had an average grade of 82 and the standard deviation was 3. Rocio earned 86.5 on the exam. • Cristina's class had an average grade of 76 and the standard deviation was 4. Cristina earmed 82.8 on the exam. Since some professors give harder exams than others, these students decided to use statistics to figure out who did the best on their exam. Use the Cumulative Z-Score Table to answer the following questions. Write your answers as a percent with two decimal places. Hint • Lucille's score places her above % of her class. • Rocio's score places her above % of her class. • Cristina's score places her above % of her class.arrow_forwardAn article in a local town newspaper discusses the results of state test scores in their town. The reporter headlines, "The students in this town don't have the necessary skills. The overall student population is less than what is reported at the state level" The state test says that a score of 261 or higher on its test reflects the student has the skills needed to graduate. A local town newspaper conducted a random sample of 200 students and found the mean to be 257 and a standard deviation of 41 points. a. State the null (H0) and alternative (Ha) hypotheses. b. Give the standard score for the data. c. Find the P-value for this significance test. e. Sketch your results on the standard Normal distribution f. Summarize the conclusion in the context of this problem.arrow_forward
- One personality test available on the World Wide Web has a subsection designed to assess the "honesty" of the test-taker. After taking the test and seeing your score for this subsection, you're interested in the mean score, µ, among the general population on this subsection. The website reports that u is 148, but you believe that u is greater than 148. You decide to do a statistical test. You choose a random sample of people and have them take the personality test. You find that their mean score on the subsection is 155 and that the standard deviation of their scores is 28. Based on this information, answer the questions below. What are the null hypothesis (H,) and the alternative hypothesis (H,) that should be used for the test? H: u is ? |H;: µ is ? ? In the context of this test, what is a Type I error? A Type I error is ? fact, u is ? v the hypothesis that u is ? v? v. when, in Suppose that you decide to reject the null hypothesis. What sort of error might you be making? ?arrow_forwardOne personality test available on the World Wide Web has a subsection designed to assess the "honesty" of the test-taker. You are interested in the mean score, μ , among the general population on this subsection. The website reports that μ is 145, but you have good reason to believe that μ is less than 145. You decide to do a statistical test. You choose a random sample of people and have them take the personality test. You find that their mean score on the subsection is 139 and that the standard deviation of their scores is 28. Based on this information, complete the parts below. (a) What are the null hypothesis H0 and the alternative hypothesis H1that should be used for the test? H0: H1: (b) Suppose that you decide to reject the null hypothesis. What sort of error might you be making? ▼(Choose one) (c) Suppose the true mean score among the general population on the subsection is 136. Fill in the blanks to describe a Type II error. A Type II error…arrow_forwardDescribe a study in which you can use both nonparametric and parametric statistics. A researcher has participants expecting to receive either painful or mild electrical shocks during a study wait in a quarter-full waiting room with other participants. He then measures whether they choose to sit next to other participants or if they sit far away on their own. What is the best test to run for this study and why?arrow_forward
- You are part of a trivia team and have tracked your team's performance since you started playing, so you know that your scores are normally distributed with u = 76 and o = 12. Recently, a new person joined the team, and you think the scores have gotten better. The sample data is n = 12, sample mean = 86 Assuming a one tailed test, What is the test statistic?arrow_forwardA random sample of 64 shoppers showed that they spend an average of $27.31 per visit at the Sunday Mornings Bookstore. The standard deviation of the population is $2.14. Find the 90% confidence interval of the true mean. Please include all work showing how you found your answer.arrow_forwardChristina wants to know the true average number of pages in a typical textbook. She randomly selects 196 books, and they have an average of 161 pages. Calculate a 90.3% confidence interval if you are given that the standard deviation for a single book is 75 pages.arrow_forward
- What is the symbol for the sample variance?arrow_forwardHistorically, the mean age of all Memphis residents has been 40 years. You believe this has changed. You take a random sample of 130 Memphis residents and find that their mean age is 36 years with a standard deviation of 17 years. Can you conclude that the mean age of all Memphis residents has changed from 40 years. For the hypothesis testing scenario above, compute the test statistic. For the hypothesis testing scenario above, you conclude that the mean age of all Memphis residents has changed from 40 years at the 0.05 significance level. Compute the 95% confidence interval to estimate the mean age of all Memphis residents.arrow_forwardOne personality test available on the World Wide Web has a subsection designed to assess the "honesty" of the test-taker. You are interested in the mean score, μ, among the general population on this subsection. The website reports that μ is 140, but you have good reason to believe that μ differs from 140. You decide to do a statistical test. You choose a random sample of people and have them take the personality test. You find that their mean score on the subsection is 146 and that the standard deviation of their scores is 22. Based on this information, complete the parts below. A. What are the null hypothesis H0 and the alternative hypothesis H1 that should be used for the test? H0: H1: B. Suppose you decide to reject the null hypothesis. Would you be making a type I or type II error?arrow_forward
 MATLAB: An Introduction with ApplicationsStatisticsISBN:9781119256830Author:Amos GilatPublisher:John Wiley & Sons Inc
 Probability and Statistics for Engineering and th...StatisticsISBN:9781305251809Author:Jay L. DevorePublisher:Cengage Learning
 Statistics for The Behavioral Sciences (MindTap C...StatisticsISBN:9781305504912Author:Frederick J Gravetter, Larry B. WallnauPublisher:Cengage Learning
 Elementary Statistics: Picturing the World (7th E...StatisticsISBN:9780134683416Author:Ron Larson, Betsy FarberPublisher:PEARSON
 The Basic Practice of StatisticsStatisticsISBN:9781319042578Author:David S. Moore, William I. Notz, Michael A. FlignerPublisher:W. H. Freeman
 Introduction to the Practice of StatisticsStatisticsISBN:9781319013387Author:David S. Moore, George P. McCabe, Bruce A. CraigPublisher:W. H. Freeman


