MATLAB: An Introduction with Applications
6th Edition
ISBN: 9781119256830
Author: Amos Gilat
Publisher: John Wiley & Sons Inc
expand_more
expand_more
format_list_bulleted
Question

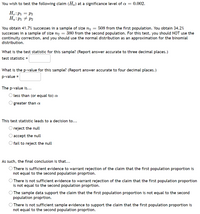
Transcribed Image Text:You wish to test the following claim (Ha) at a significance level of a = 0.002.
H.:P1 = P2
Ha:P1 + P2
You obtain 41.7% successes in a sample of size n1 = 508 from the first population. You obtain 34.2%
successes in a sample of size n2 = 380 from the second population. For this test, you should NOT use the
continuity correction, and you should use the normal distribution as an approximation for the binomial
distribution.
What is the test statistic for this sample? (Report answer accurate to three decimal places.)
test statistic=
What is the p-value for this sample? (Report answer accurate to four decimal places.)
p-value =
The p-value is...
O less than (or equal to)
greater than a
This test statistic leads to a decision to...
O reject the null
O accept the null
O fail to reject the null
As such, the final conclusion is that...
O There is sufficient evidence to warrant rejection of the claim that the first population proportion is
not equal to the second population proprtion.
O There is not sufficient evidence to warrant rejection of the claim that the first population proportion
is not equal to the second population proprtion.
O The sample data support the claim that the first population proportion is not equal to the second
population proprtion.
O There is not sufficient sample evidence to support the claim that the first population proportion is
not equal to the second population proprtion.
Expert Solution
arrow_forward
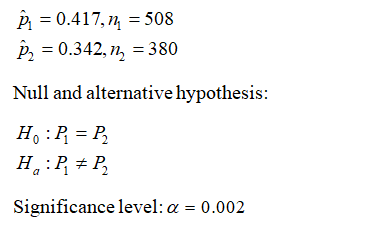
Step 1
The given information is,

arrow_forward
Step 2
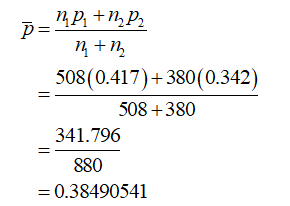
The pooled proportion or weighted estimate of p is,

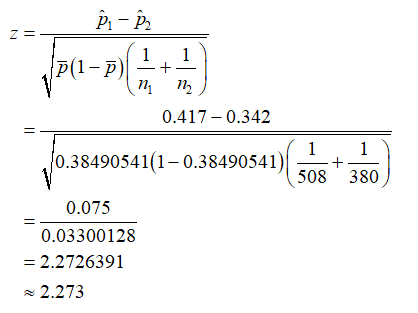
The value of test statistic is,

Thus, the value of test statistic is, z = 2.273
Step by stepSolved in 3 steps with 4 images

Knowledge Booster
Learn more about
Need a deep-dive on the concept behind this application? Look no further. Learn more about this topic, statistics and related others by exploring similar questions and additional content below.Similar questions
- A medical researcher is interested in determining if there is a relationship between adults over 50 who exercise regularly and levels of blood pressure. A random sample of 236 adults over 50 is selected and the results are given below. Calculate the test statistic to test the claim that regular exercise and blood pressure are independent. Use α = 0.01.arrow_forwardExecutives of a supermarket chain are interested in the amount of time that customers spend in the stores during shopping trips. The mean shipping time, μ, spent by customers at the supermarkets has been reported to be 40 minutes, but executives hire a statistical consultant and ask her to determine whether it can be concluded that μ is less than 40 minutes. To perform her statistical test, the consultant collects a random sample of shopping times at the supermarkets. She computes the mean of these times to be 34 minutes and the standard deviation of the times to be 16 minutes. Based on the information, answer the questions below.arrow_forwardExecutives of a supermarket chain are interested in the amount of time that customers spend in the stores during shopping trips. The mean shopping time, u, spent by customers at the supermarkets has been reported to be 35 minutes, but executives hire a statistical consultant and ask her to determine whether it can be concluded that u is greater than 35 minutes. To perform her statistical test, the consultant collects a random sample of shopping times at the supermarkets. She computes the mean of these times to be 42 minutes and the standard deviation of the times to be 10 minutes. Based on this information, answer the questions below. What are the null hypothesis (H,) and the alternative hypothesis (H,) that should be used for the test? H: u is ? H: u is ? In the context of this test, what is a Type I error? A Type I error is ? fact, u is ? ? v when, in v the hypothesis that u is? v? v. Suppose that the consultant decides to reject the null hypothesis. What sort of error might she be…arrow_forward
- Q2. You collected 500 weeks of data (2500 days total). Based on that you find Tuesday's mean return is 12 bps. Mean return of all days is 2 bps. Stdev across all days is 100 bps. There is no noticeable difference b/w Tuesday stdev vs other weekdays' stdev.Q2d. Based on 95% CI, should you reject or accept that Tuesday's mean return is not different from other weekdays?arrow_forwardBags of a certain brand of tortilla chips claim to have a net weight of 14 oz. Net weights actually vary slightly from bag to bag and are Normally distributed with mean u. A representative of a consumer advocate group wishes to see if there is any evidence that the mean net weight is less than advertised, so he intends to test the hypotheses Ho: μ = 14, Ha: μ < 14. To do this, he selects 16 bags of this brand at random and determines the net weight of each. He finds the sample mean to be x = 13.88 and the sample standard deviation to be s = 0.24. Suppose in a similar test of 16 bags of these tortilla chips the P-value is 0.001. Further suppose that a is chosen to be 0.001. In that case, we would conclude that: Othere is not significant evidence that the mean net weight of the bags of chips is less than the advertised 14 oz. O there is not significant evidence that the mean net weight of the bags of chips is not less than the advertised 14 oz. O there is significant evidence that the…arrow_forwardSuppose you had obtained a test statistic of 2.45 (this is incorrect). What would the P-value be? Draw a conclusion based on a = 0.01. Select one: O a. 0.01 < P-value < 0.02, we fail to reject Ho and do not have sufficient evidence to conclude that the mean difference in LDL from switching from an omnivorous to a plant-based diet for 6 weeks is not the same for men and women. O b. 0.005 < P-value < 0.01, we fail to reject Ho and do not have sufficient evidence to conclude that the mean difference in LDL from switching from an omnivorous to a plant-based diet for 6 weeks is not the same for men and women. O c. 0.01 < P-value < 0.02, we reject Ho and have sufficient evidence to conclude that the mean difference in LDL from switching from an omnivorous to a plant-based diet for 6 weeks is not the same for men and women. O d. 0.005 < P-value < 0.02, we reject Ho and have sufficient evidence to conclude that the mean difference in LDL from switching from an omnivorous to a plant-based diet…arrow_forward
- Assume that a high school principal believes that high number of absences hinders the students' ability to perform on standardized tests. He randomly selects a sample of 9 students who had 5 or more absences in the school year. The average ACT Composite score for this sample is X = 19 with s = 4.9. ACT Composite scores are normally distributed with u = 21.0. Do the data support the claim that the high number of absences hinders the students' ability to perform on standardized tests, using a = .05? Please show the four-step hypothesis test. %3Darrow_forwardThe Cadet is a popular model of sport utility vehicle, known for its relatively high resale value. The bivariate data given below were taken from a sample of sixteen Cadets, each bought new two years ago, and each sold used within the past month. For each Cadet in the sample, we have listed both the mileage x (in thousands of miles) that the Cadet had on its odometer at the time it was sold used and the price y (in thousands of dollars) at which the Cadet was sold used. The least-squares regression line for these data has equation Ŷ=42.80-0.53x. This line is shown in the scatter plot below. (The 2nd picture contains the rest of the data as it would not fit in the first pic and it includes the question as well.)arrow_forwardSuppose an experiment finds that people taking a new herbal remedy get fewer colds than people taking a placebo. The results are statistically significant at the 0.01 level. Has the experiment proven that the herbal remedy works?arrow_forward
- You are a consumer psychologist interested in holiday spending. A national census reports that the American family spent an average of µ = $81 for Halloween candy and costumes last year. A sample of N = 16 families this year produced a mean of $85 with s = 20. Based upon your obtained t and critical t, can you reject the null? Yes No Not enough information to decidearrow_forwardA clinical study was conducted on a medicine and the data obtained as follows: calculate Sensitivity Diseased •True Positive: 1000 •True negative: 50 Non diseased •True positive: 100 •True negative: 800arrow_forward
arrow_back_ios
arrow_forward_ios
Recommended textbooks for you
 MATLAB: An Introduction with ApplicationsStatisticsISBN:9781119256830Author:Amos GilatPublisher:John Wiley & Sons Inc
 Probability and Statistics for Engineering and th...StatisticsISBN:9781305251809Author:Jay L. DevorePublisher:Cengage Learning
 Statistics for The Behavioral Sciences (MindTap C...StatisticsISBN:9781305504912Author:Frederick J Gravetter, Larry B. WallnauPublisher:Cengage Learning
 Elementary Statistics: Picturing the World (7th E...StatisticsISBN:9780134683416Author:Ron Larson, Betsy FarberPublisher:PEARSON
 The Basic Practice of StatisticsStatisticsISBN:9781319042578Author:David S. Moore, William I. Notz, Michael A. FlignerPublisher:W. H. Freeman
 Introduction to the Practice of StatisticsStatisticsISBN:9781319013387Author:David S. Moore, George P. McCabe, Bruce A. CraigPublisher:W. H. Freeman

MATLAB: An Introduction with Applications
Statistics
ISBN:9781119256830
Author:Amos Gilat
Publisher:John Wiley & Sons Inc

Probability and Statistics for Engineering and th...
Statistics
ISBN:9781305251809
Author:Jay L. Devore
Publisher:Cengage Learning

Statistics for The Behavioral Sciences (MindTap C...
Statistics
ISBN:9781305504912
Author:Frederick J Gravetter, Larry B. Wallnau
Publisher:Cengage Learning

Elementary Statistics: Picturing the World (7th E...
Statistics
ISBN:9780134683416
Author:Ron Larson, Betsy Farber
Publisher:PEARSON

The Basic Practice of Statistics
Statistics
ISBN:9781319042578
Author:David S. Moore, William I. Notz, Michael A. Fligner
Publisher:W. H. Freeman

Introduction to the Practice of Statistics
Statistics
ISBN:9781319013387
Author:David S. Moore, George P. McCabe, Bruce A. Craig
Publisher:W. H. Freeman