MATLAB: An Introduction with Applications
6th Edition
ISBN: 9781119256830
Author: Amos Gilat
Publisher: John Wiley & Sons Inc
expand_more
expand_more
format_list_bulleted
Question

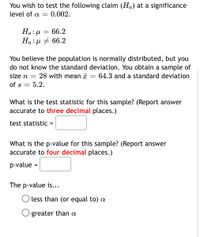
Transcribed Image Text:You wish to test the following claim (Ha) at a significance
level of a =
0.002.
66.2
Ha:µ # 66.2
You believe the population is normally distributed, but you
do not know the standard deviation. You obtain a sample of
64.3 and a standard deviation
size n
28 with mean x
of s
5.2.
What is the test statistic for this sample? (Report answer
accurate to three decimal places.)
test statistic =
What is the p-value for this sample? (Report answer
accurate to four decimal places.)
p-value
The p-value is...
less than (or equal to) a
O greater than a

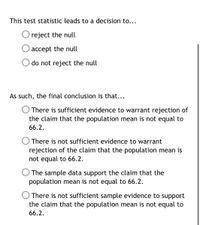
Transcribed Image Text:This test statistic leads to a decision to...
O reject the null
accept the null
do not reject the null
As such, the final conclusion is that...
O There is sufficient evidence to warrant rejection of
the claim that the population mean is not equal to
66.2.
O There is not sufficient evidence to warrant
rejection of the claim that the population mean is
not equal to 66.2.
The sample data support the claim that the
population mean is not equal to 66.2.
There is not sufficient sample evidence to support
the claim that the population mean is not equal to
66.2.
Expert Solution
This question has been solved!
Explore an expertly crafted, step-by-step solution for a thorough understanding of key concepts.
Step by stepSolved in 2 steps with 2 images

Knowledge Booster
Similar questions
- You wish to test the following claim (H) at a significance level of a = 0.005. Ho: μ = 89.5 Ha:μ > 89.5 You believe the population is normally distributed, but you do not know the standard deviation. You obtain a sample of size n = 118 with mean M = 93.2 and a standard deviation of SD = 15.6. What is the test statistic for this sample? (Report answer accurate to three decimal places.) test statistic = What is the p-value for this sample? (Report answer accurate to four decimal places.) p-value = The p-value is... O less than (or equal to) a O greater than a This test statistic leads to a decision to... O reject the null O accept the null O fail to reject the null As such, the final conclusion is that... O There is sufficient evidence to warrant rejection of the claim that the population mean is greater than 89.5. O There is not sufficient evidence to warrant rejection of the claim that the population mean is greater than 89.5. O The sample data support the claim that the population…arrow_forwardYou wish to test the following claim (Ha) at a significance level of a = 0.02. H.:µ = 75.8 H.:µ + 75.8 You believe the population is normally distributed, but you do not know the standard deviation. You obtain a sample of size n 6 with mean M = 58.9 and a standard deviation of SD = 17.2. What is the test statistic for this sample? (Report answer accurate to three decimal places.) test statistic = What is the p-value for this sample? (Report answer accurate to four decimal places.) p-value The p-value is... less than (or equal to) a greater than a This test statistic leads to a decision to... O reject the null Oaccept the null O fail to reject the nullarrow_forwardYou wish to test the following claim (Ha) at a significance level of a = Ho: :μ = 90.8 Ha : μ + 90.8 You believe the population is normally distributed, but you do not know the standard deviation. You obtain the following sample of data: 0.002. The p-value is... What is the test statistic for this sample? (Report answer accurate to three decimal places.) test statistic = less than (or equal to) a 111.5 90.6 86.9 89.7 85.6 92.4 92 93.3 104.7 96.1 82.1 90.8 98.1 95.9 98.8 101.9 100.7 95.7 111.5 86.3 102.2 94.6 92.8 83.3 103.3 89.5 99 79.1 98.8 100.7 89.5 95.4 81.3 104.2 93.3 90.8 91 89.3 101.3 91.4 97.5 92.4 98.1 82.7 100.7 95 92.4 88.5 What is the p-value for this sample? (Report answer accurate to four decimal places.) p-value = O greater than a 93.3 101.3arrow_forward
- I 15. IQ and Lead Exposure Standard IQ tests are designed to yield a population mean of 100. Data Set 11 "IQ and Lead" in Appendix B includes IQ scores of 21 children with high expo- sure to lead. For this group, the IQ scores have a mean of 86.90476 and a standard deviation of 8.988352. Use a 0.05 significance level to test the claim that this sample is from a population with mean IQ equal to 100. Do the results prove that exposure to lead has an adverse effect on IQ scores of children? Doto Fot 3? "Taxis" from Appendix B,arrow_forwardAs part of your work for an environmental group, you want to see if the mean amount of waste generated per adult in your community is less than the national average of 5 pounds per day. You take a simple random sample of 27 adults in your community and find that they average 4.1 pounds with a standard deviation of 1.4 pounds. Suppose you know the amount of waste generated per day follows a normal distribution. Test at 0.01 significance.Round answers to 4 decimal places. H0: H1: Test Statistic: P-value: Select the Decision Rule: There enough evidence to concludearrow_forwardQ1 please answerarrow_forward
- As part of your work for an environmental group, you want to see if the mean amount of waste generated per adult in your community is less than the national average of 5 pounds per day. You take a simple random sample of 23 adults in your community and find that they average 4 pounds with a standard deviation of 1.5 pounds. Suppose you know the amount of waste generated per day follows a normal distribution. Test at .10 significance.Round to the fourthH0H0: HAHA: Test Statistic: P-value: Did something significant happen? Select the Decision Rule: There enough evidence to concludearrow_forwardYou wish to test the following claim (Ha) at a significance level of a = 0.005. Ho: H Ha: µ + 56.3 56.3 You believe the population is normally distributed, but you do not know the standard deviation. You obtain the following sample of data: data 69.1 53.2 49.1 83.8 38 What is the test statistic for this sample? (Report answer accurate to three decimal places.) test statistic = What is the p-value for this sample? (Report answer accurate to four decimal places.) p-value = The p-value is... less than (or equal to) a O greater than a This test statistic leads to a decision to... O reject the null O accept the null fail to reject the null As such, the final conclusion is that... The sample data support the claim that the population mean is not equal to 56.3. There is not sufficient sample evidence to support the claim that the population mean is not equal to 56.3.arrow_forwardYou wish to test the following claim (H.) at a significance level of a= 0.05. H, µ = 84.3 Ha: > 84.3 (Claim) You believe the population is normally distrbuted, but you do not know the standard deviation. You obta a sample of size n= 115 with mean T= 88.8 and a standard deviation of s=13.4. a.) What is the test statistic for this sample? (Report answer accurate to three decimal places.) test statistic b.) What is the p-value for this sample? (Report answer accurate to four decimal places.) p-value (use Excel)arrow_forward
- You wish to test the following claim (Ha) at a significance level of a = 0.01. H:u = 76.8 H # 76.8 %3D You believe the population is normally distributed, but you do not know the standard deviation. You obtain a sample of size n = 25 with mean a 79 and a standard deviation of s = 18.7. What is the p-value for this sample? (Report answer accurate to four decimal places.) p-value = The p-value is... less than (or equal to) a greater than a This p-value leads to a decision to... reject the null Uaccept the null fail to reject the null As such, the final conclusion is that... There is sufficient evidence to warrant rejection of the claim that the population mean is not equal to 76.8. There is not sufficient evidence to warrant rejection of the claim that the population mean is not equal to 76.8. The sample data support the claim that the population mean is not equal to 76.8. There is not sufficient sample evidence to support the claim that the population mean is not equal to 76.8.arrow_forwardYou wish to test the following claim (Ha) at a significance level of a = 0.005. H.:µ = 88.5 Ha:µ > 88.5 You believe the population is normally distributed, but you do not know the standard deviation. You obtain the following sample of data: data 106.4 104.8 122.1 106.7 112.7 What is the test statistic for this sample? (Report answer accurate to three decimal places.) test statistic =arrow_forwardA coffee vending machine is adjusted so thatthe quantity of beverage poured is a normal variable ofaverage 200 ml. You buy 15 cups of coffee and you noticethat the average volume is 195 ml with a standard deviationof 2.3 ml. Can you file a complaint against the ownerof this machine for the lack of coffee in your glasses?Test at the 5% level.arrow_forward
arrow_back_ios
SEE MORE QUESTIONS
arrow_forward_ios
Recommended textbooks for you
 MATLAB: An Introduction with ApplicationsStatisticsISBN:9781119256830Author:Amos GilatPublisher:John Wiley & Sons Inc
 Probability and Statistics for Engineering and th...StatisticsISBN:9781305251809Author:Jay L. DevorePublisher:Cengage Learning
 Statistics for The Behavioral Sciences (MindTap C...StatisticsISBN:9781305504912Author:Frederick J Gravetter, Larry B. WallnauPublisher:Cengage Learning
 Elementary Statistics: Picturing the World (7th E...StatisticsISBN:9780134683416Author:Ron Larson, Betsy FarberPublisher:PEARSON
 The Basic Practice of StatisticsStatisticsISBN:9781319042578Author:David S. Moore, William I. Notz, Michael A. FlignerPublisher:W. H. Freeman
 Introduction to the Practice of StatisticsStatisticsISBN:9781319013387Author:David S. Moore, George P. McCabe, Bruce A. CraigPublisher:W. H. Freeman

MATLAB: An Introduction with Applications
Statistics
ISBN:9781119256830
Author:Amos Gilat
Publisher:John Wiley & Sons Inc

Probability and Statistics for Engineering and th...
Statistics
ISBN:9781305251809
Author:Jay L. Devore
Publisher:Cengage Learning

Statistics for The Behavioral Sciences (MindTap C...
Statistics
ISBN:9781305504912
Author:Frederick J Gravetter, Larry B. Wallnau
Publisher:Cengage Learning

Elementary Statistics: Picturing the World (7th E...
Statistics
ISBN:9780134683416
Author:Ron Larson, Betsy Farber
Publisher:PEARSON

The Basic Practice of Statistics
Statistics
ISBN:9781319042578
Author:David S. Moore, William I. Notz, Michael A. Fligner
Publisher:W. H. Freeman

Introduction to the Practice of Statistics
Statistics
ISBN:9781319013387
Author:David S. Moore, George P. McCabe, Bruce A. Craig
Publisher:W. H. Freeman