
MATLAB: An Introduction with Applications
6th Edition
ISBN: 9781119256830
Author: Amos Gilat
Publisher: John Wiley & Sons Inc
expand_more
expand_more
format_list_bulleted
Related questions
Question
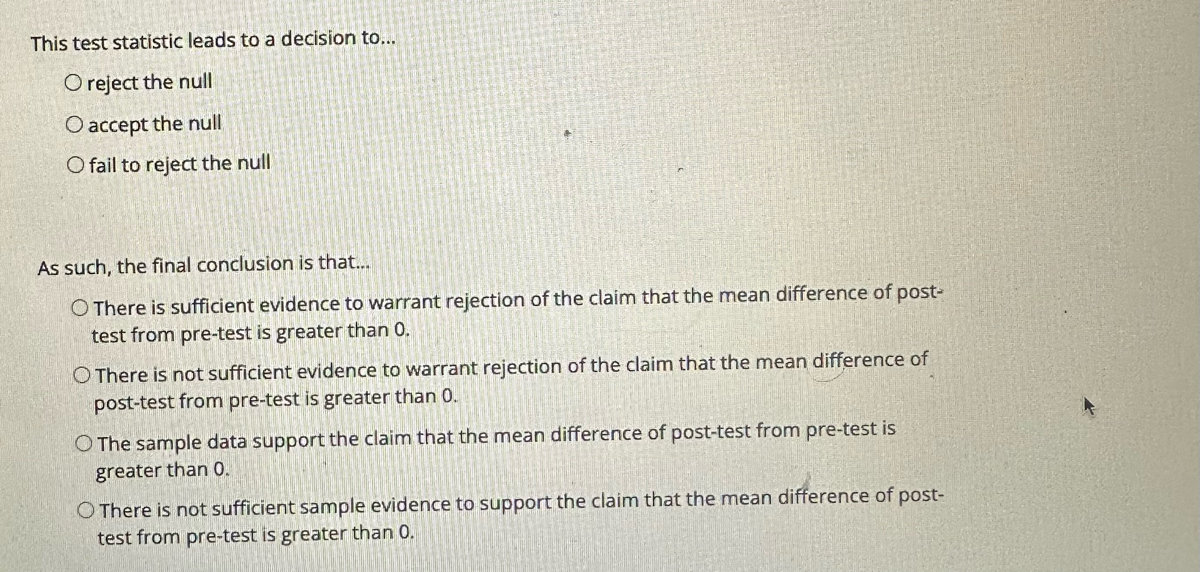

Transcribed Image Text:This test statistic leads to a decision to...
O reject the null
O accept the null
O fail to reject the null
As such, the final conclusion is that...
O There is sufficient evidence to warrant rejection of the claim that the mean difference of post-
test from pre-test is greater than 0.
O There is not sufficient evidence to warrant rejection of the claim that the mean difference of
post-test from pre-test is greater than 0.
O The sample data support the claim that the mean difference of post-test from pre-test is
greater than 0.
O There is not sufficient sample evidence to support the claim that the mean difference of post-
test from pre-test is greater than 0.

Transcribed Image Text:You wish to test the following claim (H) at a significance level of a = 0.001. For the context of this
problem, a = 2-₁ where the first data set represents a pre-test and the second data set
represents a post-test.
Ho: μd = 0
Ha:la > 0
You believe the population of difference scores is normally distributed, but you do not know the
standard deviation. You obtain pre-test and post-test samples for n = 22 subjects. The average
difference (post-pre) is d = 1 with a standard deviation of the differences of sa = 8.2.
What is the test statistic for this sample? (Report answer accurate to three decimal places.)
test statistic =
What is the p-value for this sample? (Report answer accurate to four decimal places.)
p-value =
The p-value is...
O less than (or equal to) a
Ogreater than a
Expert Solution
This question has been solved!
Explore an expertly crafted, step-by-step solution for a thorough understanding of key concepts.

This is a popular solution

Trending nowThis is a popular solution!

Step by stepSolved in 2 steps with 2 images

Knowledge Booster

Similar questions
- How can I solve?arrow_forwardYou wish to test the following claim (Ha) at a significance level of a = 0.001. H.:µ = 74.9 H.:p 74.9 You believe the population is normally distributed, but you do not know the standard deviation. You obtain a sample of size n = 84 with mean M = 74 and a standard deviation of SD = 6.4. What is the test statistic for this sample? (Report answer accurate to three decimal places.) test statistic = What is the p-value for this sample? (Report answer accurate to four decimal places.) p-value = The p-value is... O less than (or equal to) a O greater than a This test statistic leads to a decision to... O reject the null O accept the null O fail to reject the nullarrow_forwardIf a standard deviation is 1.4 away from a mean of 7.2 what is the z score of an x value of 10arrow_forward
- You wish to test the following claim (Ha) at a significance level of a = 0.10. Ho: μ = 64.2 Ha: μ < 64.2 You believe the population is normally distributed, but you do not know the standard deviation. You obtain a sample of size n = 12 with mean M = 45.9 and a standard deviation of SD = 17.1. What is the test statistic for this sample? (Report answer accurate to three decimal places.) test statistic = What is the p-value for this sample? (Report answer accurate to four decimal places.) p-value = The p-value is... O less than (or equal to) a greater than a This test statistic leads to a decision to... O reject the null accept the null fail to reject the null As such, the final conclusion is that... There is sufficient evidence to warrant rejection of the claim that the population mean is less than 64.2. There is not sufficient evidence to warrant rejection of the claim that the population mean is less than 64.2. O The sample data support the claim that the population mean is less than…arrow_forwardProfessor Nord stated that the mean score on the final exam from all the years he has been teaching is a 79%. Colby was in his most recent class, and his class’s mean score on the final exam was 82%. Colby decided to run a hypothesis test to determine if the mean score of his class was significantly greater than the mean score of the population. α = .01. What is the mean score of the population? What is the mean score of the sample? Is this test one-tailed or two-tailed? Why?arrow_forwardSuppose you are interested in testing whether average monthly gasoline expenditure differs from $50 at the 5% significance level. You take a sample of 30 and calculate a sample mean of 51 and sample standard deviation of 12. Given this information the null and alternative hypotheses are as follows: H0: μ=50 H1: μ≠50 What is the p-value for this test? (Round to four decimal places. )arrow_forward
- Using an a = 0.05 significance level, what was the evidence for your answer to the previous question? O Because the p-value of the t-test for Experience is greater than 0.05, the analyst should not reject Ho: B₁ 0 so HA B10 is unsupported. This means that there is NO statistically significant relationship between Sales and Experience. = Because the p-value of the t-test for the Intercept is less than or equal to 0.05, the analyst should reject Ho: Bo 0 and accept HA Bo 0. This means that there is a statistically significant relationship between Sales and Experience. - O Because the p-value of the t-test for Experience is less than or equal to 0.05, the analyst should reject Ho: B1 = 0 and accept HA B1 0. This means that there is a statistically significant relationship between Sales and Experience. : O Because the p-value of the t-test for Experience is less than or equal to 0.05, the analyst should reject Ho: B1 = 0 and accept HA B1 0. This means that there is NO statistically…arrow_forwardYou wish to test the following claim (H.) at a significance level of a = 0.001. For the context of this problem, Ha = 42 - 4i where the first data set represents a pre-test and the second data set represents a post-test. H.: Hd = 0 Ha:Ha + 0 You believe the population of difference scores is normally distributed, but you do not know the standard deviation. You obtain pre-test and post-test samples for n = 40 subjects. The average difference (post - pre) is d = 2.8 with a standard deviation of the differences of sa = 19.9. What is the test statistic for this sample? (Report answer accurate to three decimal places.) test statistic = What is the p-value for this sample? (Report answer accurate to four decimal places.) p-value = The p-value is... O less than (or equal to) a O greater than a This test statistic leads to a decision to... O reject the null O accept the null O fail to reject the null As such, the final conclusion is that... O There is sufficient evidence to warrant rejection…arrow_forwardYou wish to test the following claim (H) at a significance level of a = 0.05. Ho: p= 84.3 Ha : μ > 84.3 You believe the population is normally distributed, but you do not know the standard deviation. You obtain a sample of size n = 118 with mean M = 86.2 and a standard deviation of SD = 9.6. What is the test statistic for this sample? (Report answer accurate to three decimal places.) test statistic = 2.15 What is the p-value for this sample? (Report answer accurate to four decimal places.) p-value = The p-value is... O less than (or equal to) a Ogreater than a This test statistic leads to a decision to... O reject the null O accept the null O fail to reject the null F As such, the final conclusion is that... There is sufficient evidence to warrant rejection of the claim that the population mean is greater than 84.3. O There is not sufficient evidence to warrant rejection of the claim that the population mean is greater than 84.3. O The sample data support the claim that the population…arrow_forward
- You wish to test the following claim (Ha) at a significance level of a = 0.02. For the context of this problem, d PostTest – PreTest where the first data set represents a pre-test and the second data set represents a post-test. (Each row represents the pre and post test scores for an individual. Be careful when you enter your data and specify what your x1 and x2 are so that the differences are computed correctly.) H.: Hd Ha: Hd + 0 %3| You believe the population of difference scores is normally distributed, but you do not know the standard deviation. You obtain the following sample of data: pre-test post-test 50.8 42.8 57.6 46.5 59.5 52.9 62.4 49.2 57.5 55.8 52.3 54.3 62.2 49.7 58.5 56.7 61.1 60.3 60.8 54.5 65.1 64 62.9 59 55.9 49.3 60.9 51.1 64.4 62.9 50.8 41.3 59 56.4 56.1 49 66 54 60.1 52.9 62.1 59.9 55.6 46.8 56.5 53 60.3 55 55 48.4 What is the test statistic for this sample? test statistic = (Report answer accurate to 4 decimal places.)arrow_forwardYou wish to test the following claim (Ha) at a significance level of a = 0.01. For the context of this problem, µa = u2 – Hi where the first data set represents a pre-test and the second data set represents a post-test. 0 + Prl :®H You believe the population of difference scores is normally distributed, but you do not know the standard deviation. You obtain pre-test and post-test samples for n = 4 subjects. The average difference (post - pre) is d = - 14.8 with a standard deviation of the differences of sa = 49.2. What is the test statistic for this sample? (Report answer accurate to three decimal places.) test statistic = What is the p-value for this sample? (Report answer accurate to four decimal places.) p-value = The p-value is... O less than (or equal to) a greater than a This test statistic leads to a decision to... O reject the null accept the null O fail to reject the null As such, the final conclusion is that... O There is sufficient evidence to warrant rejection of the claim…arrow_forwardYou wish to test the following claim (Ha) at a significance level of α=0.002 Ho:μ=81.8 Ha:μ<81.8You believe the population is normally distributed, but you do not know the standard deviation. You obtain a sample of size n=22n=22 with mean M=76.5M=76.5 and a standard deviation of SD=14.6SD=14.6.What is the test statistic for this sample? (Report answer accurate to three decimal places.) test statistic = IncorrectWhat is the p-value for this sample? (Report answer accurate to four decimal places.) p-value = CorrectThe p-value is... less than (or equal to) αα greater than αα This test statistic leads to a decision to... reject the null accept the null fail to reject the null As such, the final conclusion is that... There is sufficient evidence to warrant rejection of the claim that the population mean is less than 81.8. There is not sufficient evidence to warrant rejection of the claim that the population mean is less than 81.8. The sample data support the claim…arrow_forward
arrow_back_ios
arrow_forward_ios
Recommended textbooks for you
- MATLAB: An Introduction with ApplicationsStatisticsISBN:9781119256830Author:Amos GilatPublisher:John Wiley & Sons Inc
 Probability and Statistics for Engineering and th...StatisticsISBN:9781305251809Author:Jay L. DevorePublisher:Cengage Learning
 Statistics for The Behavioral Sciences (MindTap C...StatisticsISBN:9781305504912Author:Frederick J Gravetter, Larry B. WallnauPublisher:Cengage Learning
  Elementary Statistics: Picturing the World (7th E...StatisticsISBN:9780134683416Author:Ron Larson, Betsy FarberPublisher:PEARSON
 The Basic Practice of StatisticsStatisticsISBN:9781319042578Author:David S. Moore, William I. Notz, Michael A. FlignerPublisher:W. H. Freeman
 Introduction to the Practice of StatisticsStatisticsISBN:9781319013387Author:David S. Moore, George P. McCabe, Bruce A. CraigPublisher:W. H. Freeman
MATLAB: An Introduction with Applications
Statistics
ISBN:9781119256830
Author:Amos Gilat
Publisher:John Wiley & Sons Inc
Probability and Statistics for Engineering and th...
Statistics
ISBN:9781305251809
Author:Jay L. Devore
Publisher:Cengage Learning
Statistics for The Behavioral Sciences (MindTap C...
Statistics
ISBN:9781305504912
Author:Frederick J Gravetter, Larry B. Wallnau
Publisher:Cengage Learning
Elementary Statistics: Picturing the World (7th E...
Statistics
ISBN:9780134683416
Author:Ron Larson, Betsy Farber
Publisher:PEARSON
The Basic Practice of Statistics
Statistics
ISBN:9781319042578
Author:David S. Moore, William I. Notz, Michael A. Fligner
Publisher:W. H. Freeman
Introduction to the Practice of Statistics
Statistics
ISBN:9781319013387
Author:David S. Moore, George P. McCabe, Bruce A. Craig
Publisher:W. H. Freeman