MATLAB: An Introduction with Applications
6th Edition
ISBN: 9781119256830
Author: Amos Gilat
Publisher: John Wiley & Sons Inc
expand_more
expand_more
format_list_bulleted
Question
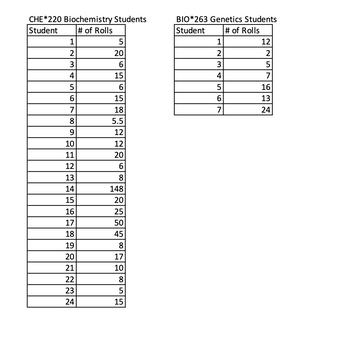
You will be comparing two sets of data for this assignment.
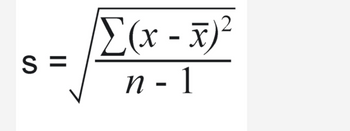
1. Determine the average number of toilet paper rolls* for Fall 2022 biochemistry and genetics students (individually) and calculate the standard deviation of each using the equation. Please be sure to show your work. I know that you can easily use tools like Microsoft Excel to calculate standard deviation, but I would like to see you complete the work by hand so that you get a sense of the role of each component of the equation. Ignore students that did not provide answers (don't use those students in themean or N value calculations).
2. Please answer the following questions when you submit your data. Which group had a higher mean number of rolls of toilet paper? Which value had the most variability? Referring to the equation, how could you decrease the amount of variability in the mean? Did you find the variation surprising or unexpected?
1. Determine the average number of toilet paper rolls* for Fall 2022 biochemistry and genetics students (individually) and calculate the standard deviation of each using the equation. Please be sure to show your work. I know that you can easily use tools like Microsoft Excel to calculate standard deviation, but I would like to see you complete the work by hand so that you get a sense of the role of each component of the equation. Ignore students that did not provide answers (don't use those students in the
2. Please answer the following questions when you submit your data. Which group had a higher mean number of rolls of toilet paper? Which value had the most variability? Referring to the equation, how could you decrease the amount of variability in the mean? Did you find the variation surprising or unexpected?
The two sets of data and the standard deviation formula pictures are attached
*Please note that a few of the values have been modified to insure anonymity.

Transcribed Image Text:CHE*220 Biochemistry Students
Student
# of Rolls
1
2
3
4
5
6
7
8
9
10
11
12
13
14
15
16
17
18
19
20
21
22
23
24
5
20
6
15
6
15
18
5.5
12
12
20
6
8
148
20
25
50
45
8
17
10
8
5
15
BIO*263 Genetics Students
Student
# of Rolls
1
2
3
4
5
6
7
12
2
5
7
16
13
24

Transcribed Image Text:S=
Σ(x - x)2
-
n-1
Expert Solution
This question has been solved!
Explore an expertly crafted, step-by-step solution for a thorough understanding of key concepts.
This is a popular solution
Trending nowThis is a popular solution!
Step by stepSolved in 4 steps

Knowledge Booster
Similar questions
- Please provide only typed answer solution no handwritten solution needed allowedarrow_forwardDetermine the range, mean, and standard deviation of the data set. {9,5,9,17,17,16,3,8} Please note that I did submit this question earlier but was unable to recognize the answers so I would appreciate it if it the answers are written clearly. Thank youarrow_forwardI need help solving this statistics problem.arrow_forward
- what do range, standard deviation and box and plot diagram have in common?arrow_forwardChapter 2, Section 3, Exercise 078 9,12,15,18,19,21,25,27,28,32,34 Using StatKey or other technology, find the following values for the above data.Click here to access StatKey.(a) The mean and the standard deviation.Round your answers to one decimal place.mean =standard deviation =(b) The five number summary.Enter exact answers.The five number summary is (, , , , )arrow_forwardPlease discuss the concepts of Mean, Median, Mode, and Standard Deviation, including when each should be used, and evaluate the differences of each. How can knowing this information about data help us?arrow_forward
- Discuss the conditions under which the median is preferred to the mean as a measure of central tendency. Provide practical examples in your explanations. And briefly explain why we generally prefer the standard deviation to the range as a measure of variability for quantitative data.arrow_forwardPlease submit the answer via a PDF document or Word document. **Correlational Analysis** Use the following data and scenario to answer the questions. You are interested in whether there is a relationship between the amount of exercise and the number of hours one sleeps. You collect the following data and conduct a correlational analysis to assess if there is a relationship the strength of the relationship. You hypothesize that there is a relationship between the amount of exercise and the number of hours one sleeps. Does the amount of exercise relate to hours of sleep? Is there a strong, moderate, or weak correlation with the following data? Is there a positive or negative relationship? What is the R (Pearson Roe Correlation Coefficient) for the data? Amount of exercising in hours per week Average hours of sleep 6 8 9 10 6 9 4 5 5 4 5 5 5 5 3 3 5 5 4 3 3 3 2 3 2 4 3 4 3 3 4 4 5 6 5 6 6 7 6 7 7 8 7 8 7 8 8 7 0 4 0 4 1 4 2 4…arrow_forwardI need help solving this statistics problem.arrow_forward
arrow_back_ios
arrow_forward_ios
Recommended textbooks for you
 MATLAB: An Introduction with ApplicationsStatisticsISBN:9781119256830Author:Amos GilatPublisher:John Wiley & Sons Inc
 Probability and Statistics for Engineering and th...StatisticsISBN:9781305251809Author:Jay L. DevorePublisher:Cengage Learning
 Statistics for The Behavioral Sciences (MindTap C...StatisticsISBN:9781305504912Author:Frederick J Gravetter, Larry B. WallnauPublisher:Cengage Learning
 Elementary Statistics: Picturing the World (7th E...StatisticsISBN:9780134683416Author:Ron Larson, Betsy FarberPublisher:PEARSON
 The Basic Practice of StatisticsStatisticsISBN:9781319042578Author:David S. Moore, William I. Notz, Michael A. FlignerPublisher:W. H. Freeman
 Introduction to the Practice of StatisticsStatisticsISBN:9781319013387Author:David S. Moore, George P. McCabe, Bruce A. CraigPublisher:W. H. Freeman

MATLAB: An Introduction with Applications
Statistics
ISBN:9781119256830
Author:Amos Gilat
Publisher:John Wiley & Sons Inc

Probability and Statistics for Engineering and th...
Statistics
ISBN:9781305251809
Author:Jay L. Devore
Publisher:Cengage Learning

Statistics for The Behavioral Sciences (MindTap C...
Statistics
ISBN:9781305504912
Author:Frederick J Gravetter, Larry B. Wallnau
Publisher:Cengage Learning

Elementary Statistics: Picturing the World (7th E...
Statistics
ISBN:9780134683416
Author:Ron Larson, Betsy Farber
Publisher:PEARSON

The Basic Practice of Statistics
Statistics
ISBN:9781319042578
Author:David S. Moore, William I. Notz, Michael A. Fligner
Publisher:W. H. Freeman

Introduction to the Practice of Statistics
Statistics
ISBN:9781319013387
Author:David S. Moore, George P. McCabe, Bruce A. Craig
Publisher:W. H. Freeman