
MATLAB: An Introduction with Applications
6th Edition
ISBN: 9781119256830
Author: Amos Gilat
Publisher: John Wiley & Sons Inc
expand_more
expand_more
format_list_bulleted
Related questions
Question
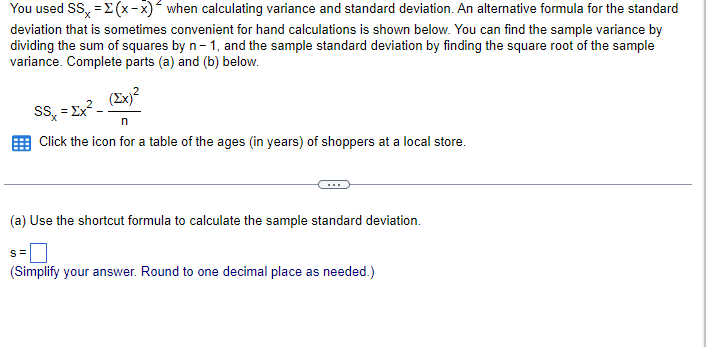

Transcribed Image Text:You used SS, = Σ(x-x) when calculating variance and standard deviation. An alternative formula for the standard
deviation that is sometimes convenient for hand calculations is shown below. You can find the sample variance by
dividing the sum of squares by n-1, and the sample standard deviation by finding the square root of the sample
variance. Complete parts (a) and (b) below.
(Ex)²
SSx
Click the icon for a table of the ages (in years) of shoppers at a local store.
= Σχε
(a) Use the shortcut formula to calculate the sample standard deviation.
S=
(Simplify your answer. Round to one decimal place as needed.)

Transcribed Image Text:4
n ex
You used SS = x (x-x)² when calculating variance and standard deviation. An alternative formula for the standard
deviation that is sometimes convenient for hand calculations is shown below. You can find the sample variance by
dividing the sum of squares by n-1, and the sample standard deviation by finding the square root of the sample
variance. Complete parts (a) and (b) below.
(Ex)²
SS = Ex².
Click the icon for a table of the ages (in years) of shoppers at a local store.
Data table
19
16
15
18
20
17
19
16
Shoppers' Ages
20
20
18
18
20
19
24
20
18
18
16
16
n
X
ar all
Check answer
Expert Solution
This question has been solved!
Explore an expertly crafted, step-by-step solution for a thorough understanding of key concepts.

This is a popular solution

Trending nowThis is a popular solution!

Step by stepSolved in 2 steps

Knowledge Booster

Similar questions
- Find the z-score that has 68.4% of the distribution's area to its right. Can you also give the steps in the calculator? TI-84arrow_forwardFind the z-score that has 70.54% of the distribution's area to its right. Click to view page 1 of the table. Click to view page 2 of the table. O A. - 0.82 В. - 0.54 С. 0.82 D. 0.54arrow_forwardfind the standard deviation step by step. that is find the deviation of each observation from the mean, square the deviations then obtain the variance and the standard deviation.i found the mean : 10.05i need help finding the standard deviation and the variancearrow_forward
- The coefficient of variation CV describes the standard deviation as a percent of the mean. Because it has no units, you can use the coefficient of variation to compare data with different units. Find the coefficient of variation for each sample data set. What can you conclude? Standard deviation CV = • 100% Mean E Click the icon to view the data sets. Data Table C/heights = 5.0 % (Round to the nearest tenth as needed.) Heights Weights CVweights =% (Round to the nearest tenth as needed.) 68 181 77 169 72 167 72 207 71 177 70 175 78 185 69 186 67 221 70 216 67 209 73 206arrow_forwardThe variance and the standard deviation are related by the fact that the square root of the variance is equal to the standard deviation. Suppose the variance of the time it takes to complete a bachelor's degree is 0.8. Find the standard deviation. Round your answer to four decimal places.arrow_forwardFind the area of the shaded region. The graph to the right depicts IQ scores of adults, and those scores are normally distributed with a mean of 100 and a standard deviation of 15. Click to view page 1 of the table. Click to view page 2 of the table. 120 The area of the shaded region is - (Round to four decimal places as needed.)arrow_forward
arrow_back_ios
arrow_forward_ios
Recommended textbooks for you
- MATLAB: An Introduction with ApplicationsStatisticsISBN:9781119256830Author:Amos GilatPublisher:John Wiley & Sons Inc
 Probability and Statistics for Engineering and th...StatisticsISBN:9781305251809Author:Jay L. DevorePublisher:Cengage Learning
 Statistics for The Behavioral Sciences (MindTap C...StatisticsISBN:9781305504912Author:Frederick J Gravetter, Larry B. WallnauPublisher:Cengage Learning
  Elementary Statistics: Picturing the World (7th E...StatisticsISBN:9780134683416Author:Ron Larson, Betsy FarberPublisher:PEARSON
 The Basic Practice of StatisticsStatisticsISBN:9781319042578Author:David S. Moore, William I. Notz, Michael A. FlignerPublisher:W. H. Freeman
 Introduction to the Practice of StatisticsStatisticsISBN:9781319013387Author:David S. Moore, George P. McCabe, Bruce A. CraigPublisher:W. H. Freeman
MATLAB: An Introduction with Applications
Statistics
ISBN:9781119256830
Author:Amos Gilat
Publisher:John Wiley & Sons Inc
Probability and Statistics for Engineering and th...
Statistics
ISBN:9781305251809
Author:Jay L. Devore
Publisher:Cengage Learning
Statistics for The Behavioral Sciences (MindTap C...
Statistics
ISBN:9781305504912
Author:Frederick J Gravetter, Larry B. Wallnau
Publisher:Cengage Learning
Elementary Statistics: Picturing the World (7th E...
Statistics
ISBN:9780134683416
Author:Ron Larson, Betsy Farber
Publisher:PEARSON
The Basic Practice of Statistics
Statistics
ISBN:9781319042578
Author:David S. Moore, William I. Notz, Michael A. Fligner
Publisher:W. H. Freeman
Introduction to the Practice of Statistics
Statistics
ISBN:9781319013387
Author:David S. Moore, George P. McCabe, Bruce A. Craig
Publisher:W. H. Freeman