
MATLAB: An Introduction with Applications
6th Edition
ISBN: 9781119256830
Author: Amos Gilat
Publisher: John Wiley & Sons Inc
expand_more
expand_more
format_list_bulleted
Related questions
Concept explainers
Question
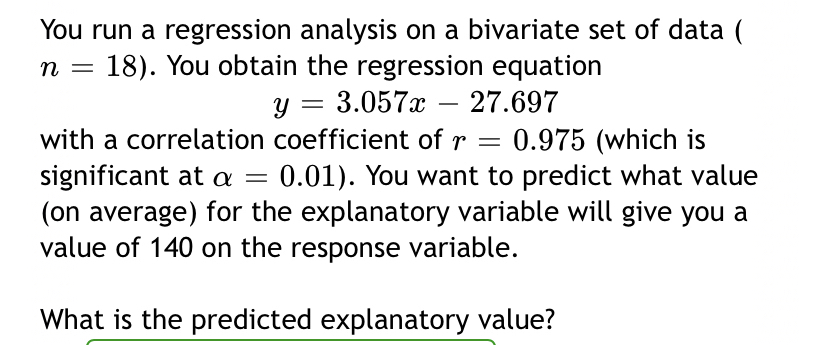

Transcribed Image Text:You run a regression analysis on a bivariate set of data (
18). You obtain the regression equation
y = 3.057x –- 27.697
with a correlation coefficient of r = 0.975 (which is
significant at a =
(on average) for the explanatory variable will give you a
value of 140 on the response variable.
0.01). You want to predict what value
What is the predicted explanatory value?
Expert Solution
This question has been solved!
Explore an expertly crafted, step-by-step solution for a thorough understanding of key concepts.

This is a popular solution

Trending nowThis is a popular solution!

Step by stepSolved in 2 steps

Knowledge Booster


Learn more about
Need a deep-dive on the concept behind this application? Look no further. Learn more about this topic, statistics and related others by exploring similar questions and additional content below.Similar questions
- You run a regression analysis on a bivariate set of data (n=109). With x¯=72.2 and y¯=34.7, you obtain the regression equation y= - 0.898x - 42.514 with a correlation coefficient of r=-0.086. You want to predict what value (on average) for the response variable will be obtained from a value of 140 as the explanatory variable. What is the predicted response value? y =arrow_forwardsee attachedarrow_forwardYou run a regression analysis on a bivariate set of data (n=28). You obtain the regression equation y=3.542x+23.399 with a correlation coefficient of r=0.877 (which is significant at α=0.01). You want to predict what value (on average) for the explanatory variable will give you a value of 10 on the response variable.What is the predicted explanatory value?x = (Report answer accurate to one decimal place.)arrow_forward
- If you have a b of 0.56 in a regression equation, what does this mean? For every one-unit increase in x, you get an increase of 0.56 in y r = .31 On average, the variability of real scores around the regression line is 0.56 For every 1 standard deviation increase in x, you get an increase of 0.56 standard deviations in yarrow_forwardYou run a regression analysis on a bivariate set of data (n = 22). With ☎ = 22.3 and y = 58.5, you obtain the regression equation y = 0.842x + 37.664 with a correlation coefficient of r = 0.897. You want to predict what value (on average) for the response variable will be obtained from a value of 180 as the explanatory variable. What is the predicted response value? y = (Report answer accurate to one decimal place.)arrow_forwardYou run a regression analysis on a bivariate set of data (n = 120). With i = 66.3 and y = 50.6, you obtain the regression equation y = 4.097x – 11.636 with a correlation coefficient of r = 0.56. You want to predict what value (on average) for the response variable will be obtained from a value of 120 as the explanatory variable. What is the predicted response value? y = (Report answer accurate to one decimal place.)arrow_forward
- You run a regression analysis on a bivariate set of data (n = 89). With a = 35.4 and y = 53.5, you obtain the regression equation %3D y = 3.651x – 38.171 0.1. You want to predict what value (on average) for the %3D - with a correlation coefficient of r = response variable will be obtained from a value of 110 as the explanatory variable. What is the predicted response value? y%3Darrow_forwardYou run a regression analysis on a bivariate set of data (n=15). You obtain the regression equationy=2.339x+22.015 with a correlation coefficient of r=0.886 (which is significant at α=0.01). You want to predict what value (on average) for the explanatory variable will give you a value of 150 on the response variable.What is the predicted explanatory value?x = (Report answer accurate to one decimal place.)arrow_forwardPlease help me with this problem using the TI 84 You run a regression analysis on a bivariate set of data (n=85n). With ¯x=21.3 and ¯y=25.4, you obtain the regression equation y=−3.558x+48.067 with a correlation coefficient of r=−0.022. You want to predict what value (on average) for the response variable will be obtained from a value of 150 as the explanatory variable.What is the predicted response value?y =arrow_forward
arrow_back_ios
arrow_forward_ios
Recommended textbooks for you
- MATLAB: An Introduction with ApplicationsStatisticsISBN:9781119256830Author:Amos GilatPublisher:John Wiley & Sons Inc
 Probability and Statistics for Engineering and th...StatisticsISBN:9781305251809Author:Jay L. DevorePublisher:Cengage Learning
 Statistics for The Behavioral Sciences (MindTap C...StatisticsISBN:9781305504912Author:Frederick J Gravetter, Larry B. WallnauPublisher:Cengage Learning
  Elementary Statistics: Picturing the World (7th E...StatisticsISBN:9780134683416Author:Ron Larson, Betsy FarberPublisher:PEARSON
 The Basic Practice of StatisticsStatisticsISBN:9781319042578Author:David S. Moore, William I. Notz, Michael A. FlignerPublisher:W. H. Freeman
 Introduction to the Practice of StatisticsStatisticsISBN:9781319013387Author:David S. Moore, George P. McCabe, Bruce A. CraigPublisher:W. H. Freeman
MATLAB: An Introduction with Applications
Statistics
ISBN:9781119256830
Author:Amos Gilat
Publisher:John Wiley & Sons Inc
Probability and Statistics for Engineering and th...
Statistics
ISBN:9781305251809
Author:Jay L. Devore
Publisher:Cengage Learning
Statistics for The Behavioral Sciences (MindTap C...
Statistics
ISBN:9781305504912
Author:Frederick J Gravetter, Larry B. Wallnau
Publisher:Cengage Learning
Elementary Statistics: Picturing the World (7th E...
Statistics
ISBN:9780134683416
Author:Ron Larson, Betsy Farber
Publisher:PEARSON
The Basic Practice of Statistics
Statistics
ISBN:9781319042578
Author:David S. Moore, William I. Notz, Michael A. Fligner
Publisher:W. H. Freeman
Introduction to the Practice of Statistics
Statistics
ISBN:9781319013387
Author:David S. Moore, George P. McCabe, Bruce A. Craig
Publisher:W. H. Freeman