
MATLAB: An Introduction with Applications
6th Edition
ISBN: 9781119256830
Author: Amos Gilat
Publisher: John Wiley & Sons Inc
expand_more
expand_more
format_list_bulleted
Related questions
Concept explainers
Question
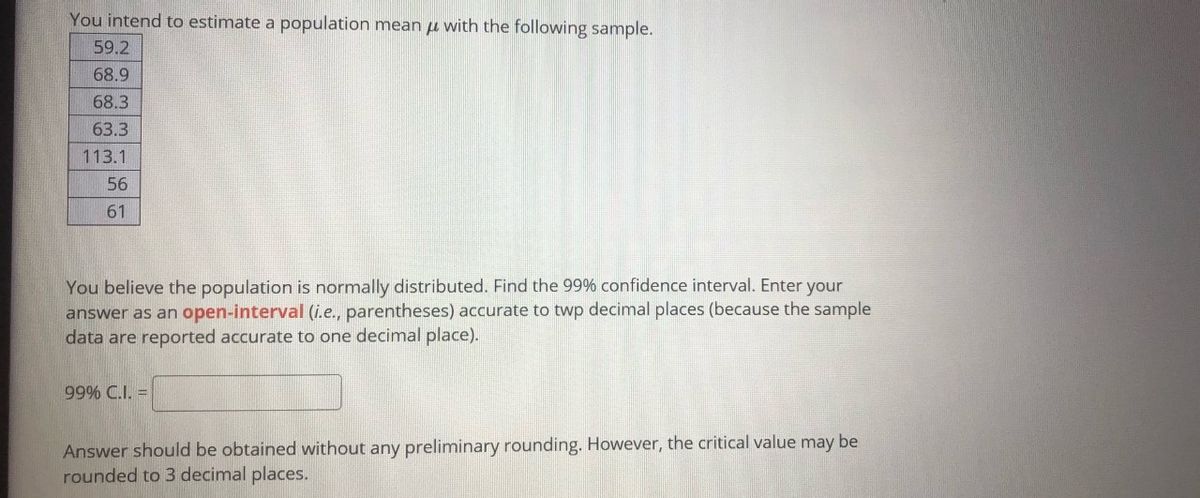

Transcribed Image Text:You intend to estimate a population mean u with the following sample.
59.2
68.9
68.3
63.3
113.1
56
61
You believe the population is normally distributed. Find the 99% confidence interval. Enter your
answer as an open-interval (i.e., parentheses) accurate to twp decimal places (because the sample
data are reported accurate to one decimal place).
99% C.I. =
Answer should be obtained without any preliminary rounding. However, the critical value may be
rounded to 3 decimal places.
Expert Solution
This question has been solved!
Explore an expertly crafted, step-by-step solution for a thorough understanding of key concepts.

This is a popular solution

Trending nowThis is a popular solution!

Step by stepSolved in 2 steps with 2 images

Knowledge Booster


Learn more about
Need a deep-dive on the concept behind this application? Look no further. Learn more about this topic, statistics and related others by exploring similar questions and additional content below.Similar questions
- You are given the sample mean and the population standard deviation. Use this information to construct the 90% and 95% confidence intervals for the population mean. Interpret the results and compare the widths of the confidence intervals. If convenient, use technology to construct the confidence intervals. A random sample of 45 home theater systems has a mean price of $ 125.00. Assume the population standard deviation is $ 16.70. Construct a 90% confidence interval for the population mean.arrow_forwardYou are given the sample mean and the population standard deviation. Use this information to construct the 90% and 95% confidence intervals for the population mean. Interpret the results and compare the widths of the confidence intervals. If convenient, use technology to construct the confidence intervals. A random sample of 55 home theater systems has a mean price of $120.00. Assume the population standard deviation is $18.20.arrow_forwardUse the sample data and confidence level given below to complete parts (a) through (d). K A research institute poll asked respondents if they felt vulnerable to identity theft. In the poll, n = 1100 and x = 501 who said "yes." Use a 99% confidence level. Click the icon to view a table of z scores. 10 on 11 me solve this "1 a) Find the best point estimate of the population proportion p. 0 (Round to three decimal places as needed.) View an example Get more help. on 5858 409 x PROV H command % 3 a w ER T Q ER AL G SDFO C с MacBook Air T II B U N M K O 38 Clear all cfnm P ? I command alt optionarrow_forward
- Tina catches a 14-pound bass. She does not know the population mean or standard deviation. So she takes a sample of five friends and they say the last bass they caught was 9, 12, 13, 10, and 10 pounds. Find the t and calculate a 95% (α = .05) confidence interval.arrow_forwardYou are given the sample mean and the population standard deviation. Use this information to construct the 90% and 95% confidence intervals for the population mean. Interpret the results and compare the widths of the confidence intervals. If convenient, use technology to construct the confidence intervals. A random sample of 45 home theater systems has a mean price of $114.00. Assume the population standard deviation is $15.30. Construct a 90% confidence interval for the population mean.arrow_forwardNeed ASAParrow_forward
- You intend to estimate a population mean u with the following sample. 95.6 77.1 72.5 83.2 81.1 72.3 73.4 63.1 You believe the population is normally distributed. Find the 99.5% confidence interval. Enter your answer as an open-interval (i.e., parentheses) accurate to twp decimal places (because the sample data are reported accurate to one decimal place). 99.5% C.I. = Answer should be obtained without any preliminary rounding. However, the critical value may be rounded to 3 decimal places. Submit Question Ce Ol 96 & 3. 00 27 %23arrow_forward9 The standard error of the mean is, a 0.881 b 0.735 c 0.612 d 0.510arrow_forwardYou are given the sample mean and the population standard deviation. Use this information to construct the 90% and 95% confidence intervals for the population mean. Interpret the results and compare the widths of the confidence intervals. If convenient, use technology to construct the confidence intervals. A random sample of 40 home theater systems has a mean price of $130.00. Assume the population standard deviation is $18.50. The 90% confidence interval is ( 125.19), 134.81). (Round to two decimal places as needed.) Construct a 95% confidence interval for the population mean. The 95% confidence interval is ( 124.27 , 135.73). (Round to two decimal places as needed.) Interpret the results. Choose the correct answer below. O A. With 90% confidence, it can be said that the population mean price lies in the first interval. With 95% confidence, it can be said that the population mean price lies in the second interval. The 95% confidence interval is narrower than the 90%. O B. With 90%…arrow_forward
- You are given the sample mean and the population standard deviation. Use this information to construct the 90% and 95% confidence intervals for the population mean. Interpret the results and compare the widths of the confidence intervals. If convenient, use technology to construct the confidence intervals. 10. A random sample of 40 home theater systems has a mean price of $126.00. Assume the population standard deviation is $16.70. Construct a 90% confidence interval for the population mean. The 90% confidence interval is (nothing,nothing)arrow_forwardResearchers studied the mean egg length (in millimeters) for a bird population. After taking a random sample of eggs, they obtained a 95% confidence interval of (45,60). What is the value of the margin of error? Choose the correct answer below. A. 15 mm B. 52.5 mm O c. 7.5 mm O D. 1.96arrow_forwardplease round the answer to thousandth place. the other person did hundredths so It was incorrectarrow_forward
arrow_back_ios
SEE MORE QUESTIONS
arrow_forward_ios
Recommended textbooks for you
- MATLAB: An Introduction with ApplicationsStatisticsISBN:9781119256830Author:Amos GilatPublisher:John Wiley & Sons Inc
 Probability and Statistics for Engineering and th...StatisticsISBN:9781305251809Author:Jay L. DevorePublisher:Cengage Learning
 Statistics for The Behavioral Sciences (MindTap C...StatisticsISBN:9781305504912Author:Frederick J Gravetter, Larry B. WallnauPublisher:Cengage Learning
  Elementary Statistics: Picturing the World (7th E...StatisticsISBN:9780134683416Author:Ron Larson, Betsy FarberPublisher:PEARSON
 The Basic Practice of StatisticsStatisticsISBN:9781319042578Author:David S. Moore, William I. Notz, Michael A. FlignerPublisher:W. H. Freeman
 Introduction to the Practice of StatisticsStatisticsISBN:9781319013387Author:David S. Moore, George P. McCabe, Bruce A. CraigPublisher:W. H. Freeman
MATLAB: An Introduction with Applications
Statistics
ISBN:9781119256830
Author:Amos Gilat
Publisher:John Wiley & Sons Inc
Probability and Statistics for Engineering and th...
Statistics
ISBN:9781305251809
Author:Jay L. Devore
Publisher:Cengage Learning
Statistics for The Behavioral Sciences (MindTap C...
Statistics
ISBN:9781305504912
Author:Frederick J Gravetter, Larry B. Wallnau
Publisher:Cengage Learning
Elementary Statistics: Picturing the World (7th E...
Statistics
ISBN:9780134683416
Author:Ron Larson, Betsy Farber
Publisher:PEARSON
The Basic Practice of Statistics
Statistics
ISBN:9781319042578
Author:David S. Moore, William I. Notz, Michael A. Fligner
Publisher:W. H. Freeman
Introduction to the Practice of Statistics
Statistics
ISBN:9781319013387
Author:David S. Moore, George P. McCabe, Bruce A. Craig
Publisher:W. H. Freeman