MATLAB: An Introduction with Applications
6th Edition
ISBN: 9781119256830
Author: Amos Gilat
Publisher: John Wiley & Sons Inc
expand_more
expand_more
format_list_bulleted
Concept explainers
Question
thumb_up100%

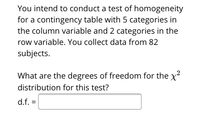
Transcribed Image Text:You intend to conduct a test of homogeneity
for a contingency table with 5 categories in
the column variable and 2 categories in the
row variable. You collect data from 82
subjects.
What are the degrees of freedom for the x²
distribution for this test?
d.f. =
Expert Solution
This question has been solved!
Explore an expertly crafted, step-by-step solution for a thorough understanding of key concepts.
This is a popular solution
Trending nowThis is a popular solution!
Step by stepSolved in 2 steps with 2 images

Knowledge Booster
Learn more about
Need a deep-dive on the concept behind this application? Look no further. Learn more about this topic, statistics and related others by exploring similar questions and additional content below.Similar questions
- The average house has 14 paintings on its walls. Is the mean larger for houses owned by teachers? The data show the results of a survey of 14 teachers who were asked how many paintings they have in their houses. Assume that the distribution of the population is normal. 15, 13, 16, 16, 17, 14, 14, 15, 13, 13, 15, 16, 15, 16 What can be concluded at the a = 0.01 level of significance? a. For this study, we should use Select an answer b. The null and alternative hypotheses would be: Но: ? Select an answer v H: ?v Select an answer v c. The test statistic ? v = (please show your answer to 3 decimal places.) d. The p-value = (Please show your answer to 4 decimal places.) e. The p-value is ? va f. Based on this, we should Select an answer v the null hypothesis. g. Thus, the final conclusion is that ... O The data suggest that the population mean number of paintings that are in teachers' houses is not significantly more than 14 at a = 0.01, so there is insufficient evidence to conclude that…arrow_forwardA researcher wanted to test whether there is a relationship between preferred sweet (Oreo cookies, Mars bars, or Twinkies) and age group (children, adolescents, or young adults). To test that, subjects from the three age groups were asked which of the three sweets they preferred. Which statistical test should be used to analyze the data? 1. chi square test of independece 2. chi square test for goodness of fit 3. one sample t test 4. one way anova testarrow_forwardWhat are the values for SS and variance for the following sample of n = 3 scores? Sample: 8, 5, 2arrow_forward
- thanks for attempting my question. would appreciate a quick response and an explanation. thanks Question 1 of 4 Assume that we have 6 manifest variables and 3 factors. The communality of 3 on variable 74 is obtained with the following: 34 O B. Y 34 O D. Y43 Question 3 of 4 Assume we have 6 manifest variables and 3 factors. The proportion of variance in the 2nd manifest variable accounted for by all of the factors can be represented as follows: O A. 22 О в. C. 13 33 Y 63 O D. 2-2; = Y21 +?22+?23arrow_forwardThe following data said shows the bank account balance for a random sample of 17 IRSC students.  Round solution to two decimal places if necessary. What is the mean of this data set? Mean= What is the median of this data set? Median= What is the mode of this data set if no modes exist type DNE. if multiple modes exist enter the values in a comma separated lists Mode=arrow_forwardPlease answer all parts. One question, This is not graded. it is practicearrow_forward
- An analysis of variance produces SSbetween = 75 and MSbetween = 15. In this analysis, how many treatment conditions are being compared? Select one: a. 3 b. 4 c. 5 d. 6arrow_forwardplease complete the blank problem and or ones with a red x next to it not ones with a green check next to pleasearrow_forwardPlease help with this asaparrow_forward
arrow_back_ios
arrow_forward_ios
Recommended textbooks for you
 MATLAB: An Introduction with ApplicationsStatisticsISBN:9781119256830Author:Amos GilatPublisher:John Wiley & Sons Inc
 Probability and Statistics for Engineering and th...StatisticsISBN:9781305251809Author:Jay L. DevorePublisher:Cengage Learning
 Statistics for The Behavioral Sciences (MindTap C...StatisticsISBN:9781305504912Author:Frederick J Gravetter, Larry B. WallnauPublisher:Cengage Learning
 Elementary Statistics: Picturing the World (7th E...StatisticsISBN:9780134683416Author:Ron Larson, Betsy FarberPublisher:PEARSON
 The Basic Practice of StatisticsStatisticsISBN:9781319042578Author:David S. Moore, William I. Notz, Michael A. FlignerPublisher:W. H. Freeman
 Introduction to the Practice of StatisticsStatisticsISBN:9781319013387Author:David S. Moore, George P. McCabe, Bruce A. CraigPublisher:W. H. Freeman

MATLAB: An Introduction with Applications
Statistics
ISBN:9781119256830
Author:Amos Gilat
Publisher:John Wiley & Sons Inc

Probability and Statistics for Engineering and th...
Statistics
ISBN:9781305251809
Author:Jay L. Devore
Publisher:Cengage Learning

Statistics for The Behavioral Sciences (MindTap C...
Statistics
ISBN:9781305504912
Author:Frederick J Gravetter, Larry B. Wallnau
Publisher:Cengage Learning

Elementary Statistics: Picturing the World (7th E...
Statistics
ISBN:9780134683416
Author:Ron Larson, Betsy Farber
Publisher:PEARSON

The Basic Practice of Statistics
Statistics
ISBN:9781319042578
Author:David S. Moore, William I. Notz, Michael A. Fligner
Publisher:W. H. Freeman

Introduction to the Practice of Statistics
Statistics
ISBN:9781319013387
Author:David S. Moore, George P. McCabe, Bruce A. Craig
Publisher:W. H. Freeman