MATLAB: An Introduction with Applications
6th Edition
ISBN: 9781119256830
Author: Amos Gilat
Publisher: John Wiley & Sons Inc
expand_more
expand_more
format_list_bulleted
Question

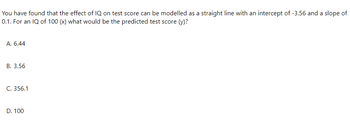
Transcribed Image Text:You have found that the effect of IQ on test score can be modelled as a straight line with an intercept of -3.56 and a slope of
0.1. For an IQ of 100 (x) what would be the predicted test score (y)?
A. 6.44
B. 3.56
C. 356.1
D. 100
Expert Solution
This question has been solved!
Explore an expertly crafted, step-by-step solution for a thorough understanding of key concepts.
Step by stepSolved in 2 steps with 1 images

Knowledge Booster
Similar questions
- in a regression analysis 68% of students test score is determined by class absenteeism. The relationship between class absenteeism and test score has a linear equation of Y= 34-0.85(X) what the correlation coefficient is a. 0.4624 b. -0.85 c. -0.8246 d none of the above e.0.68arrow_forward4arrow_forwardThe table gives the amount of money (in dollars) spent on football by a major university. Letting a represent the number of years since 2005, and letting y represent the amount of money spent on football, in thousands of dollars, use the regression capabilities of a graphing calculator to find the equation of the line of best fit. Round values off to the nearest hundredth. Then, use your equation to make the following predictions. Year 2005 2006 2007 2008 2009 2010 Dollars spent on football 165,000 196,000 210,000 226,000 242,000 279,000 The equation of the line of best fit is: Hint Predict the amount of money that will be spent on football in the year 2024. +A Predict the amount of money that will be spent on football in the year 2041.arrow_forward
- An experiment measures how long mice take to find the cheese in a maze, Y;, and compares it with the result of a different measurement of the mouse's intelligence, X;. Based on the results for just 4 mice (see table below), calculate the slope of the line of best fit. (Give your answer correct to 3 decimal places.) Mouse number, i 1 4 Intelligence, X; 10 12 14 19 Time to find cheese, Y40.839.3 28.9 22.8 Answer: Check Type here to search 19 hp 3. 2.arrow_forwardA regression was run to determine if there is a relationship between hours of TV watched per day (x) and number of situps a person can do (y). The results of the regression were: y=ax+b a=-1.226 b=33.622 r²-0.4489 r=-0.67 Use this to predict the number of situps a person who watches 3 hours of TV can do (to one decimal place)arrow_forwardUsing the regression formula with a slope = .704 and an intercept = .719, what would the predicted college GPA be for a student whose current high school GPA = 3.2?arrow_forward
- A regression was run to determine if there is a relationship between hours of TV watched per day (x) and number of situps a person can do (y).The results of the regression were: y=ax+b a=-0.609 b=27.646 r2=0.910116 r=-0.954 Use this to predict the number of situps a person who watches 12 hours of TV can do (to one decimal place)arrow_forwardUse the regression equation to predict the suicide rate for a state with a divorce rate of 6.5. Y = -0.20 + 2.87xarrow_forwardUsing the regression formula with a slope = 5000 and intercept = 10,000, what would the predicted income be for someone who has 15 years of education? A. 60,000 B. 150,000 C. 85,000 D. 75,000arrow_forward
- The linear regression equation for the data from the number 2 is y=.27x+5.82. Describe the slope of the linear best-fit equations.arrow_forwardI’m taking a statistics and probability class. Please get this correct because I want to learn. I have gotten wrong answers on here beforearrow_forwardA regression was run to determine if there is a relationship between hours of TV watched per day (x) and number of situps a person can do (y). The results of the regression were: y=a+bx b=-0.66 a=25.376 r²=0.390625 r=-0.625 Use this to predict the number of situps a person who watches 2.5 hours of TV can do. place. Round to one decimalarrow_forward
arrow_back_ios
SEE MORE QUESTIONS
arrow_forward_ios
Recommended textbooks for you
 MATLAB: An Introduction with ApplicationsStatisticsISBN:9781119256830Author:Amos GilatPublisher:John Wiley & Sons Inc
 Probability and Statistics for Engineering and th...StatisticsISBN:9781305251809Author:Jay L. DevorePublisher:Cengage Learning
 Statistics for The Behavioral Sciences (MindTap C...StatisticsISBN:9781305504912Author:Frederick J Gravetter, Larry B. WallnauPublisher:Cengage Learning
 Elementary Statistics: Picturing the World (7th E...StatisticsISBN:9780134683416Author:Ron Larson, Betsy FarberPublisher:PEARSON
 The Basic Practice of StatisticsStatisticsISBN:9781319042578Author:David S. Moore, William I. Notz, Michael A. FlignerPublisher:W. H. Freeman
 Introduction to the Practice of StatisticsStatisticsISBN:9781319013387Author:David S. Moore, George P. McCabe, Bruce A. CraigPublisher:W. H. Freeman

MATLAB: An Introduction with Applications
Statistics
ISBN:9781119256830
Author:Amos Gilat
Publisher:John Wiley & Sons Inc

Probability and Statistics for Engineering and th...
Statistics
ISBN:9781305251809
Author:Jay L. Devore
Publisher:Cengage Learning

Statistics for The Behavioral Sciences (MindTap C...
Statistics
ISBN:9781305504912
Author:Frederick J Gravetter, Larry B. Wallnau
Publisher:Cengage Learning

Elementary Statistics: Picturing the World (7th E...
Statistics
ISBN:9780134683416
Author:Ron Larson, Betsy Farber
Publisher:PEARSON

The Basic Practice of Statistics
Statistics
ISBN:9781319042578
Author:David S. Moore, William I. Notz, Michael A. Fligner
Publisher:W. H. Freeman

Introduction to the Practice of Statistics
Statistics
ISBN:9781319013387
Author:David S. Moore, George P. McCabe, Bruce A. Craig
Publisher:W. H. Freeman